Fig. 2.
Download original image
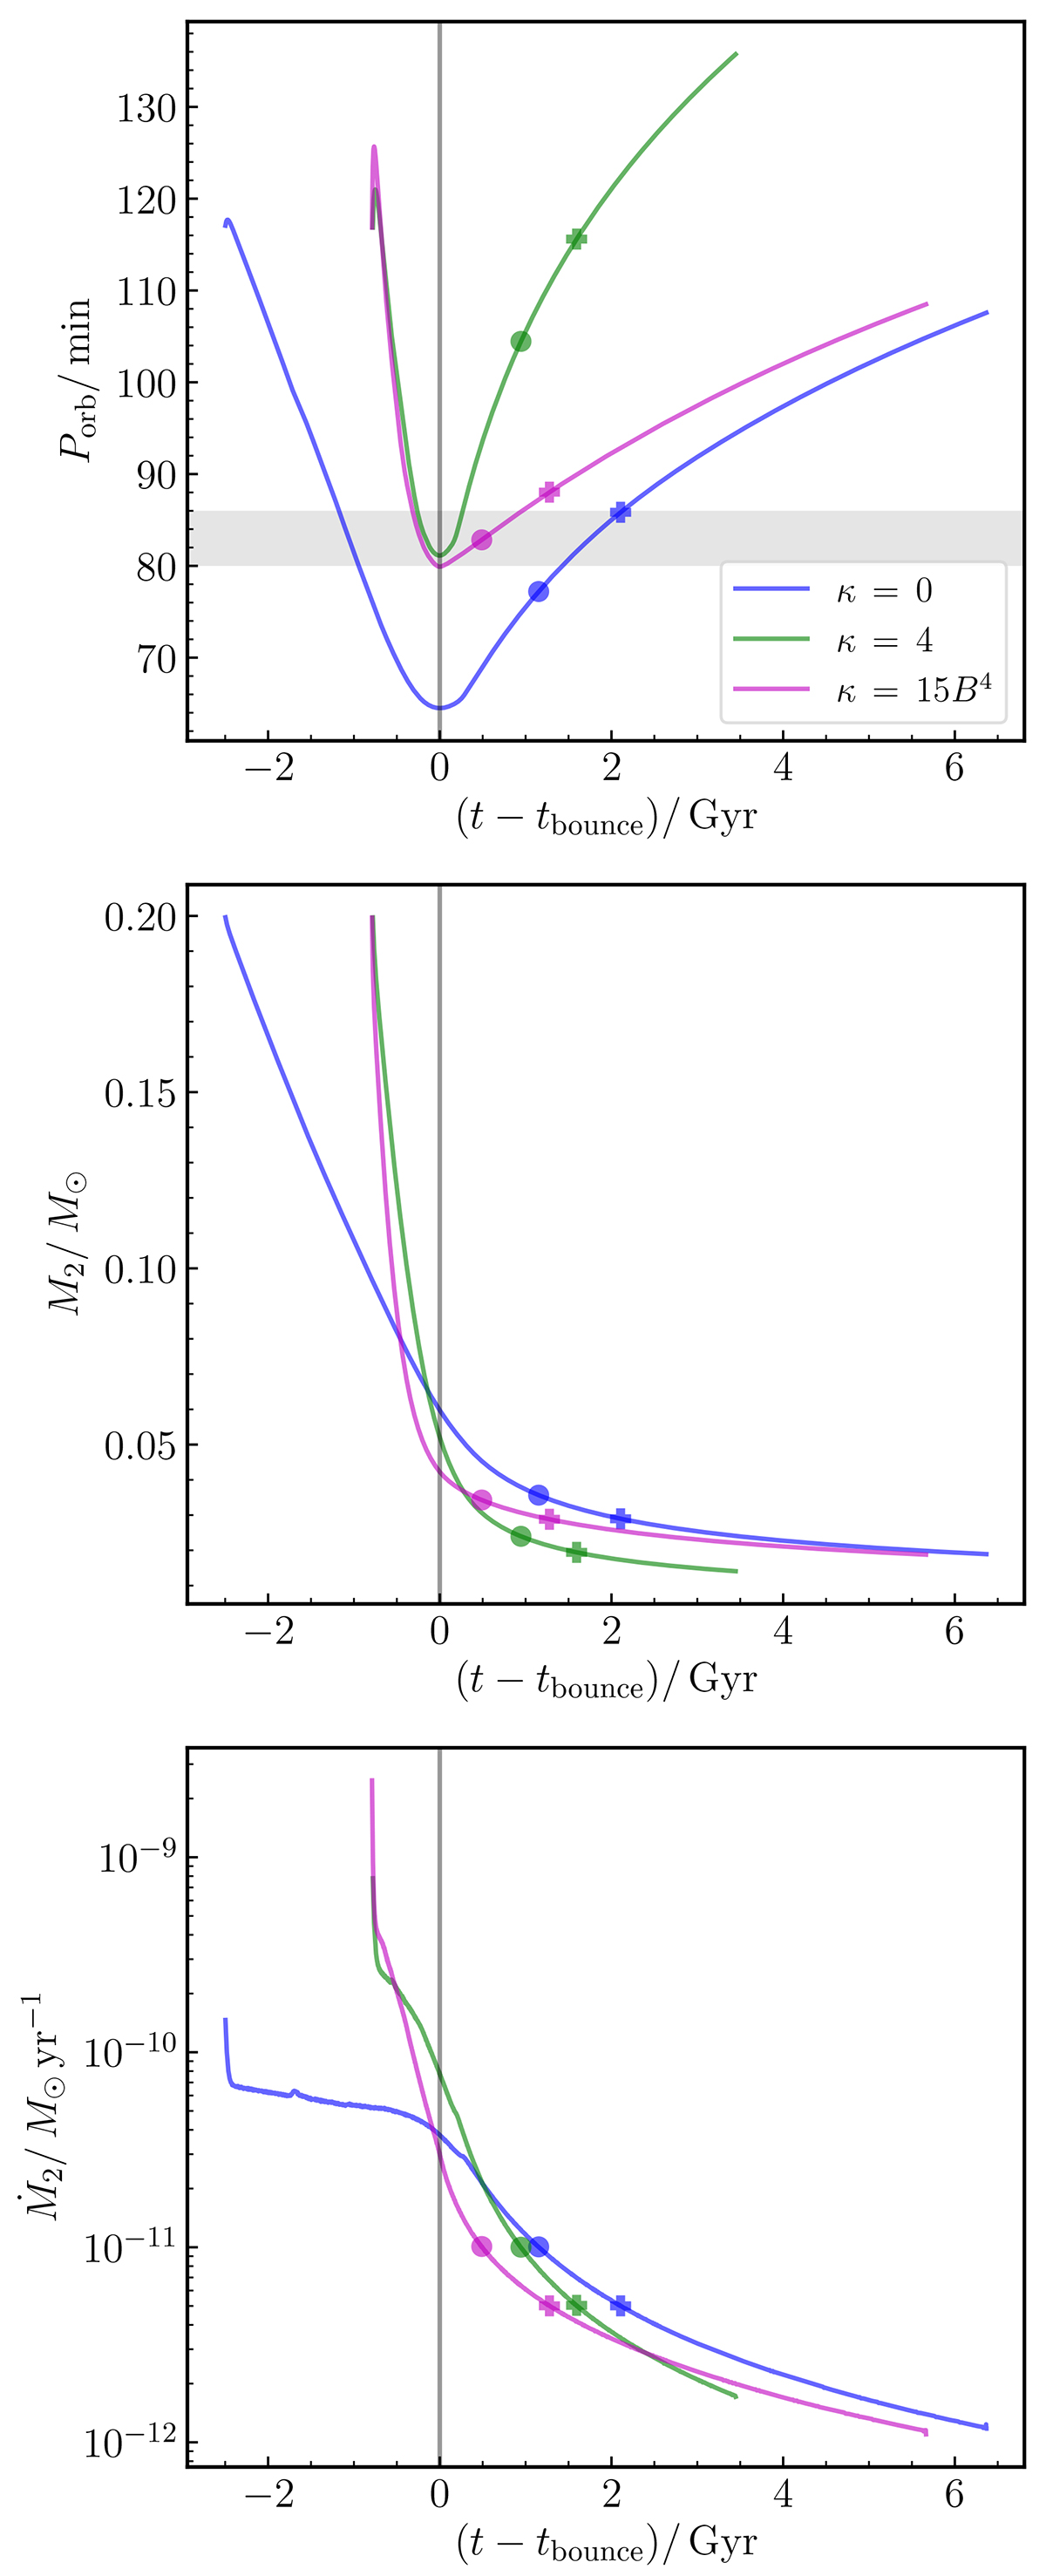
Time evolution of Porb, M2, and Ṁ2 for three choices of κ. The vertical black line in each subplot is the time at which the system attains its period minimum (tbounce). The circles and pluses in each track mark detection thresholds of Ṁ2 = 10−11 M⊙ yr−1 and 5 × 10⁻¹² M⊙ yr−1 (see text). The shaded region in the top subplot is the observed period minimum spike.
Current usage metrics show cumulative count of Article Views (full-text article views including HTML views, PDF and ePub downloads, according to the available data) and Abstracts Views on Vision4Press platform.
Data correspond to usage on the plateform after 2015. The current usage metrics is available 48-96 hours after online publication and is updated daily on week days.
Initial download of the metrics may take a while.