Fig. 8
Download original image
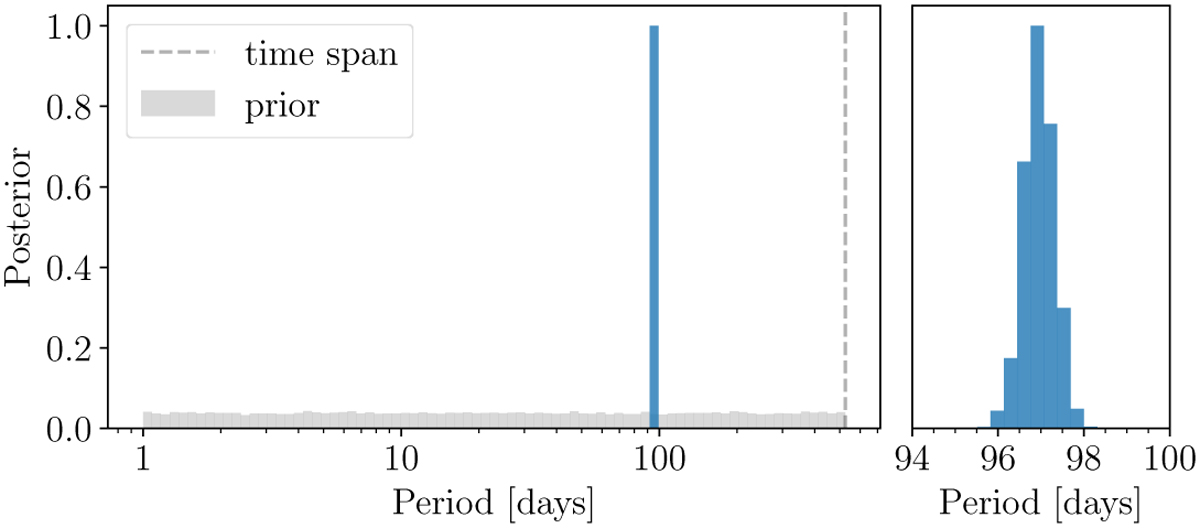
Posterior distribution (blue) for the orbital period from the kima fit of only RV data. The posterior distribution’s highest peak corresponds to a period of 97 days. The prior distribution is shown as an extended grey box near the bottom of the plot and is log-uniform from 1 day to the time span of the data at ~500 days, as shown by the dotted grey line.
Current usage metrics show cumulative count of Article Views (full-text article views including HTML views, PDF and ePub downloads, according to the available data) and Abstracts Views on Vision4Press platform.
Data correspond to usage on the plateform after 2015. The current usage metrics is available 48-96 hours after online publication and is updated daily on week days.
Initial download of the metrics may take a while.