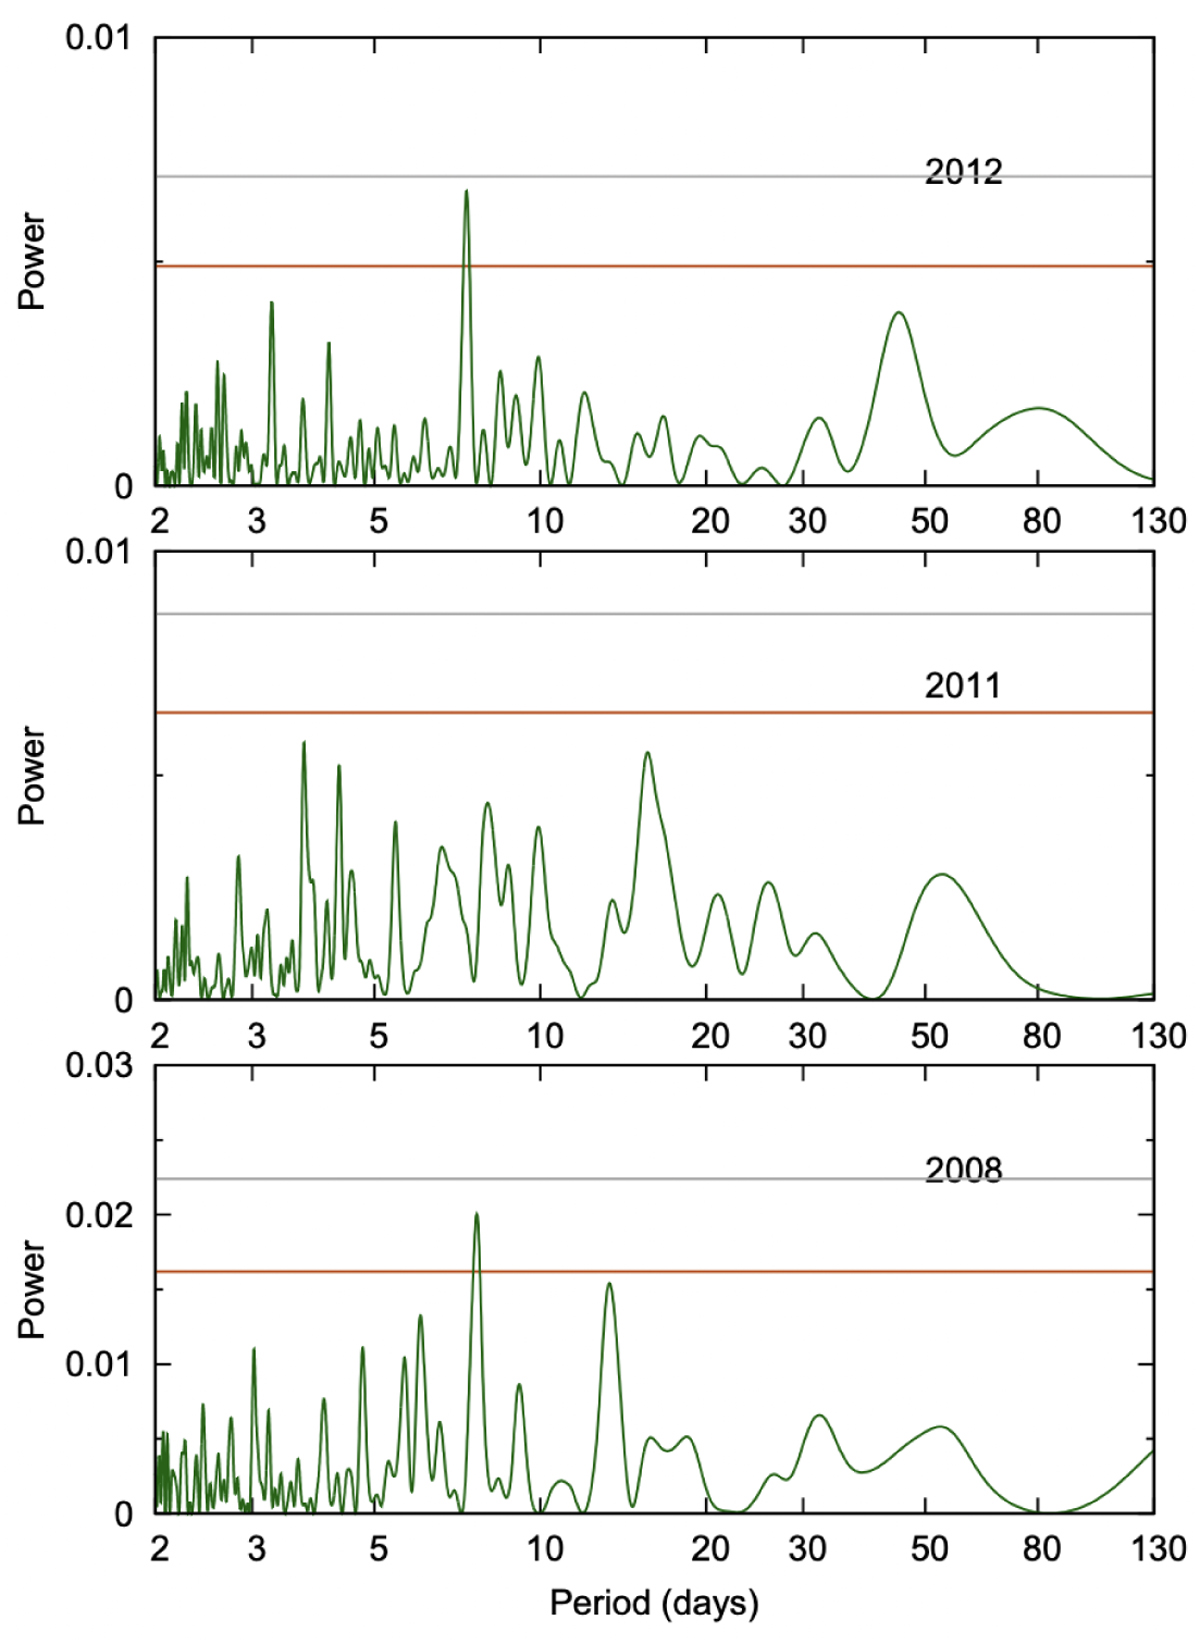
Fig. 6
Download original image
WASP rotation analysis: Lomb-Scargle periodograms were run for three separate years of WASP photometry, in 2012, 2011, and 2008 (from top to bottom). 1% and 10% false alarm probability levels (estimated with methods from Maxted et al. 2011) are shown as grey and red lines, respectively. The same ~7.5 days rotation signal is marginally detected in 2012 and 2008, while the highest peak in the 2011 data is at 3.73 days, which could be a harmonic of the 7.5 days signal.
Current usage metrics show cumulative count of Article Views (full-text article views including HTML views, PDF and ePub downloads, according to the available data) and Abstracts Views on Vision4Press platform.
Data correspond to usage on the plateform after 2015. The current usage metrics is available 48-96 hours after online publication and is updated daily on week days.
Initial download of the metrics may take a while.