Fig. 5
Download original image
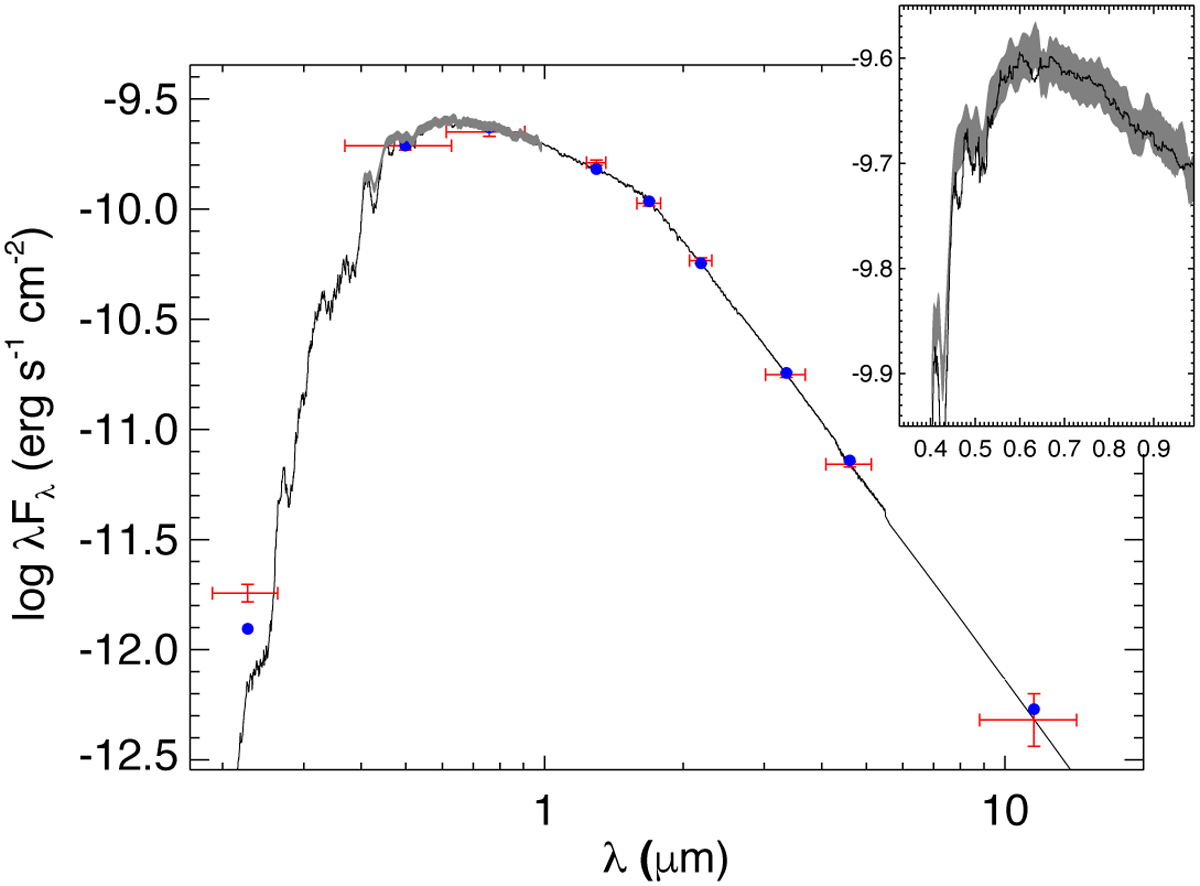
Spectral energy distribution of TOI-4862. Red symbols represent the observed photometric measurements, and the horizontal bars represent the effective width of the passband. Blue symbols are the model fluxes from the best-fit PHOENIX atmosphere model (black). The absolute flux-calibrated Gaia spectrum is shown as a grey swathe in the inset figure. We note that the discrepancy between the blue points and PHOENIX atmosphere model at the shortest wavelengths is due to the SED being so steep in the UV that the nominal band-pass effective wavelength ends up being different from the flux-weighted effective wavelength.
Current usage metrics show cumulative count of Article Views (full-text article views including HTML views, PDF and ePub downloads, according to the available data) and Abstracts Views on Vision4Press platform.
Data correspond to usage on the plateform after 2015. The current usage metrics is available 48-96 hours after online publication and is updated daily on week days.
Initial download of the metrics may take a while.