Fig. 3
Download original image
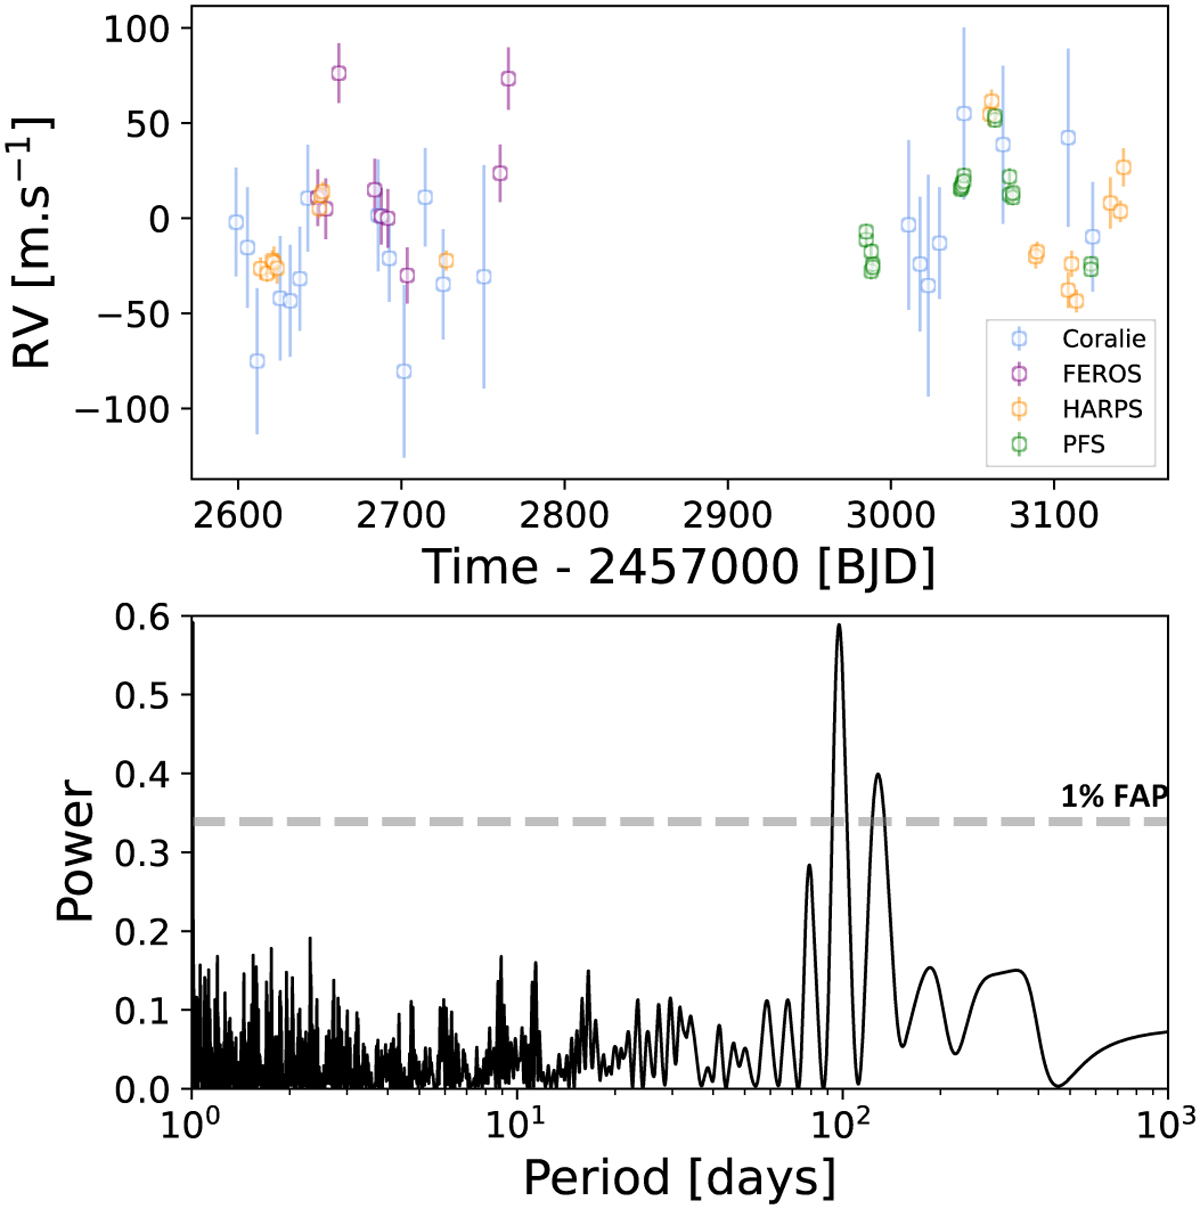
Overview of collected RV data Top: all collected RV observations for TOI-4862. CORALIE points are shown in blue, FEROS in purple, HARPS in orange, and PFS in green. All points are shown as empty circles, with their 1σ errors shown as straight lines. Inter-instrument offsets have been removed. Bottom: Lomb-Scargle periodogram for the collected RV observations. The 1% false alarm probability (FAP) is shown by the dotted grey line. The highest peak corresponds to a period of about 97.4 days.
Current usage metrics show cumulative count of Article Views (full-text article views including HTML views, PDF and ePub downloads, according to the available data) and Abstracts Views on Vision4Press platform.
Data correspond to usage on the plateform after 2015. The current usage metrics is available 48-96 hours after online publication and is updated daily on week days.
Initial download of the metrics may take a while.