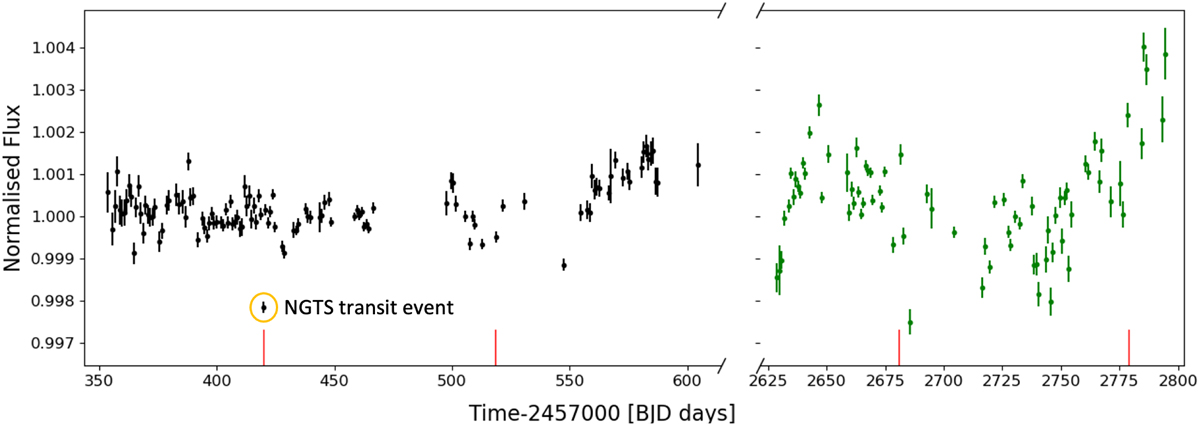
Fig. 2
Download original image
NGTS monitoring plot showing average nightly fluxes for TOI-4862. Archival NGTS data (from before the TESS transit) are plotted in black, and follow-up monitoring is plotted in green with 1-σ flux errors. Measurements obtained on nights overly affected by noise or weather as well as four monitoring points from different NGTS telescopes with different offsets are not shown. Red lines denote the expected times of transit for NGTS-30 b/TOI-4862-b, with the first one aligning with the captured NGTS transit (circled). Nightly errors are generally higher in the newer datasets because the typical observation lengths were shorter in this monitoring stage.
Current usage metrics show cumulative count of Article Views (full-text article views including HTML views, PDF and ePub downloads, according to the available data) and Abstracts Views on Vision4Press platform.
Data correspond to usage on the plateform after 2015. The current usage metrics is available 48-96 hours after online publication and is updated daily on week days.
Initial download of the metrics may take a while.