Fig. 1
Download original image
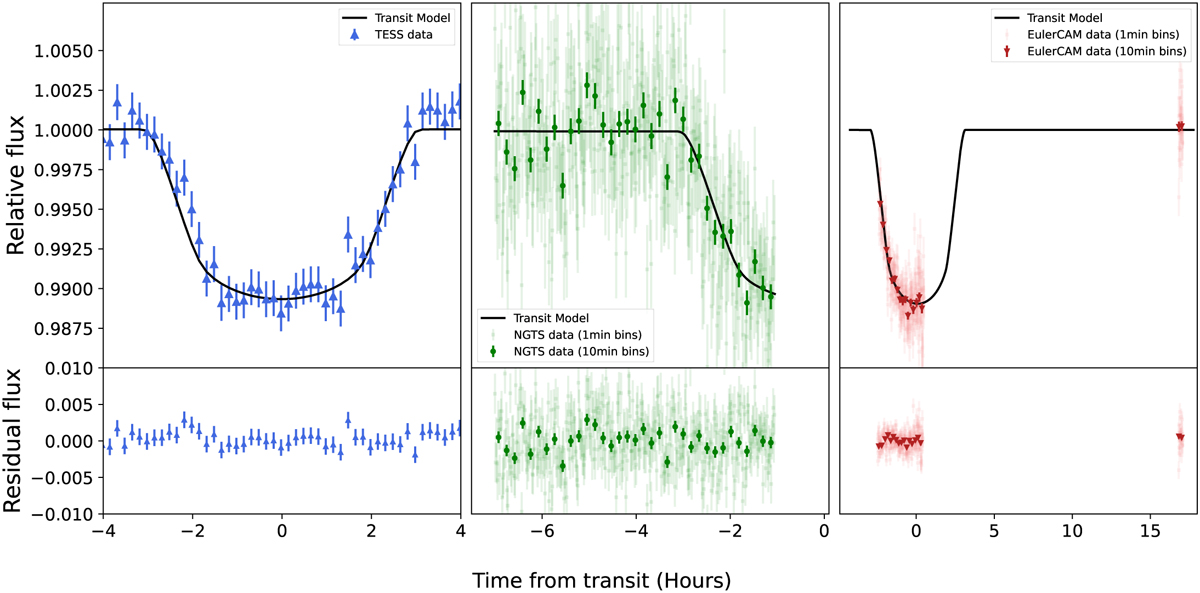
Fitted transits from TESS (left), NGTS (middle), and EulerCam (right) along with their residuals after removing the transit model (lower panels). Because of the high-cadence of the NGTS and EulerCam data, data are shown binned to 1 minute (in lighter colours) and 10 minute bins (darker colours) to align with the TESS data. The joint transit model is over-plotted in black.
Current usage metrics show cumulative count of Article Views (full-text article views including HTML views, PDF and ePub downloads, according to the available data) and Abstracts Views on Vision4Press platform.
Data correspond to usage on the plateform after 2015. The current usage metrics is available 48-96 hours after online publication and is updated daily on week days.
Initial download of the metrics may take a while.