Fig. 8.
Download original image
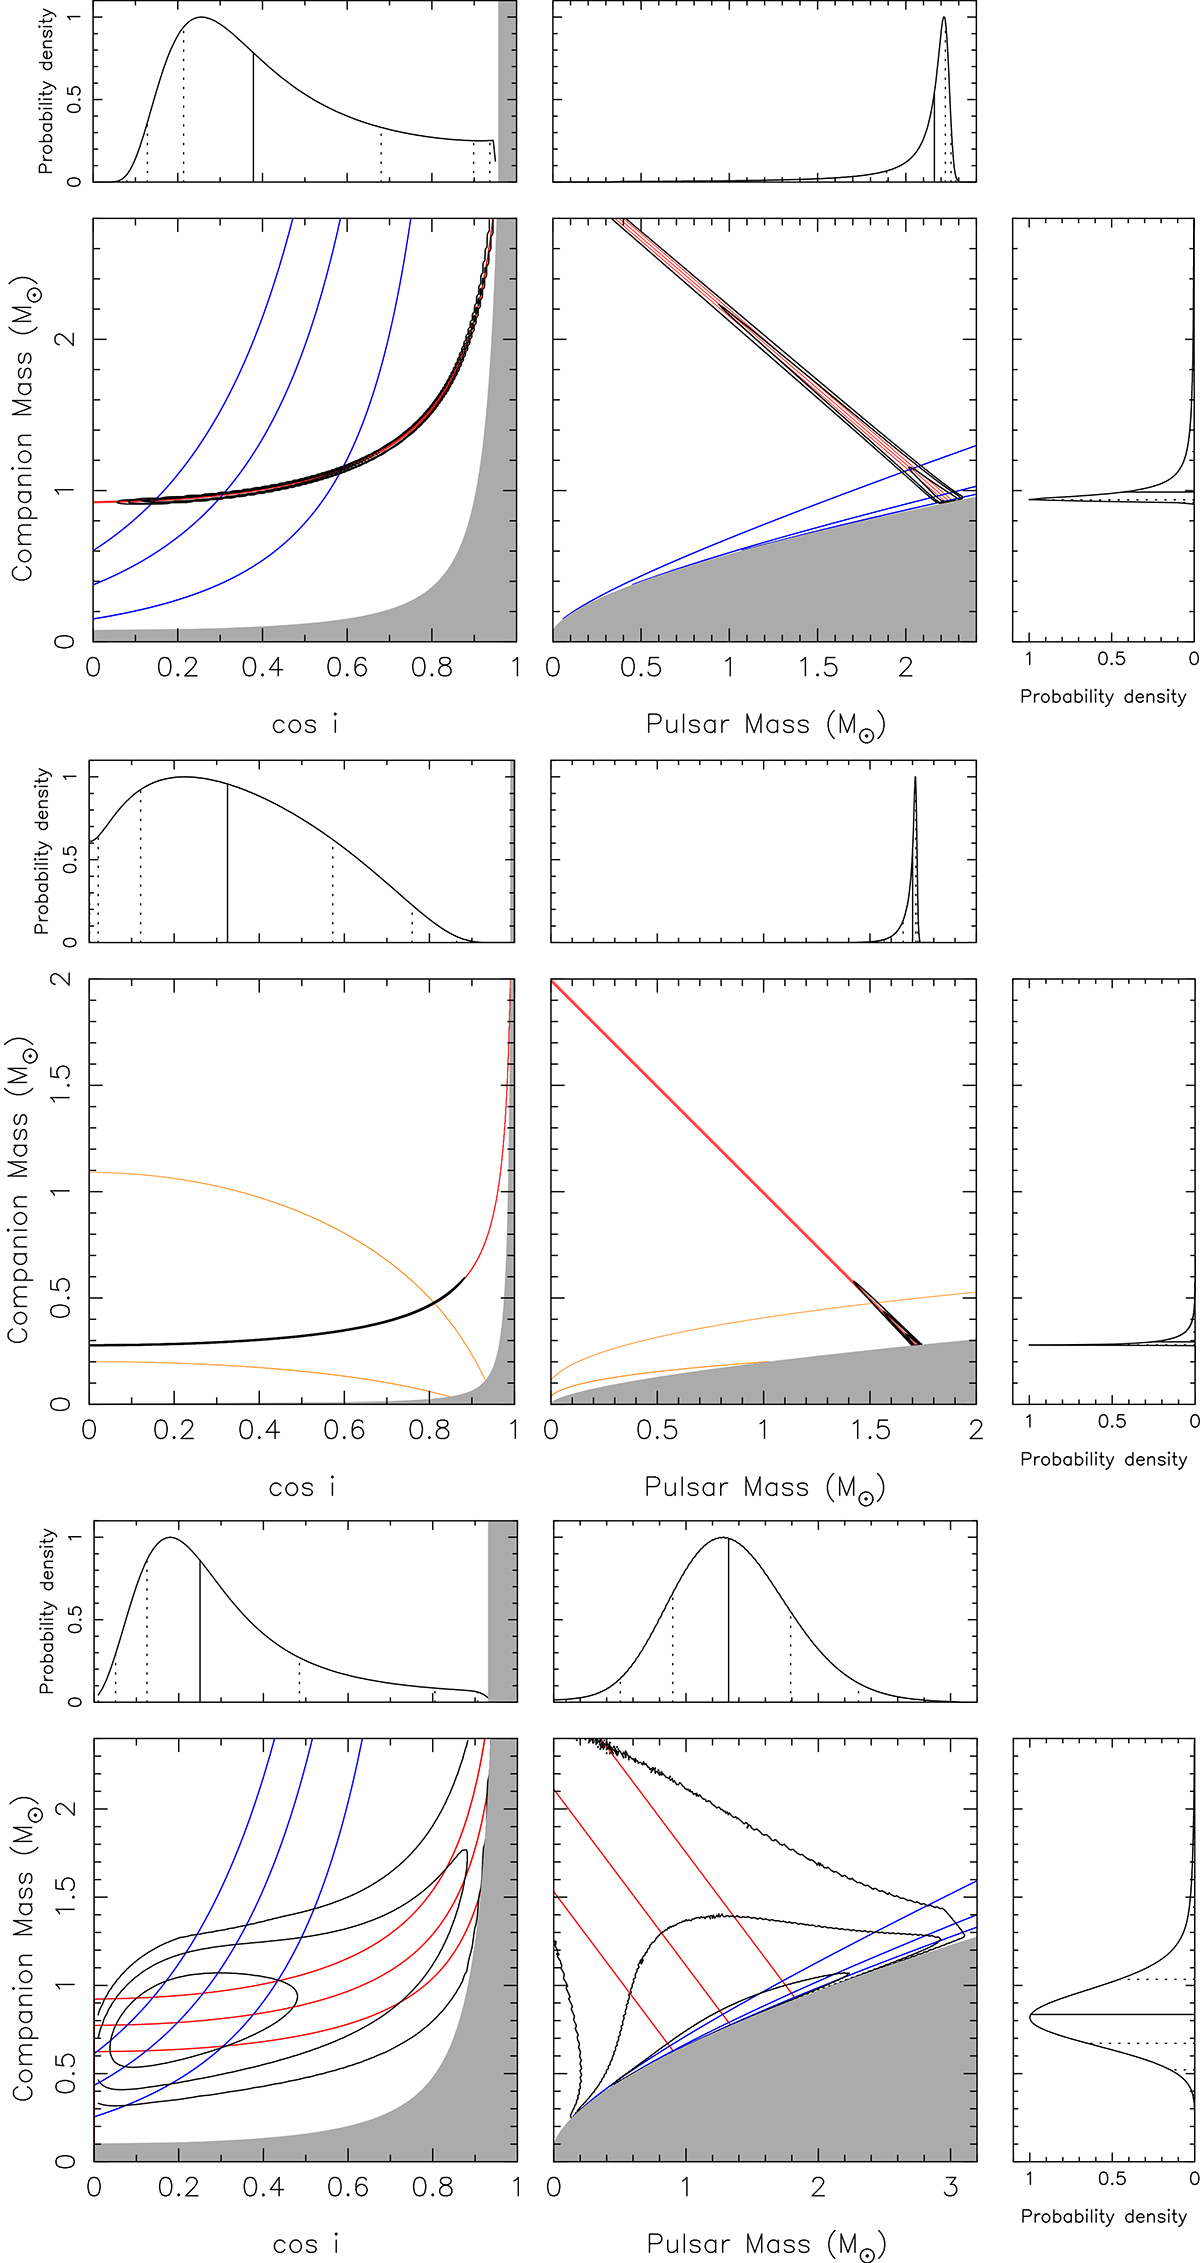
Mass-mass diagrams for Ter5ao (top), Ter5ap (middle), and Ter5aw (bottom). The main panels show Mc as a function of cos i (left) and Mp (right). In the left panels, the regions marked in gray are excluded because they imply a negative pulsar mass. For the panels on the right, the gray regions are constrained by the mass function and sin i < 1. The black contours include 68.3, 95.4 and 99.7% of all probability in the 2-D joint posterior probability distribution functions (pdfs) of each panel. The red lines indicate constraints derived from the nominal values of the total mass derived from the nominal value of ![]() and the ±1-σ uncertainties of its measurement. The minimum companion masses for Ter5ao and Ter5ap are constrained by
and the ±1-σ uncertainties of its measurement. The minimum companion masses for Ter5ao and Ter5ap are constrained by ![]() and the limit of sin i < 1 giving Mc > 0.8 M⊙ and Mc > 0.278 M⊙ respectively, this results in Mp < 2.23 M⊙ and Mp < 1.72 M⊙ respectively. The blue lines represent the constraints derived from the nominal and ±1-σ limits of the orthometric amplitude of the Shapiro delay, h3. The orange lines designate the 2 and 3-σ upper limits derived for Ter5ap. The top panels depict the normalised 1-D pdfs for cos i, Mp and, on the side, Mc. The medians of the pdfs are depicted by the solid black lines, the dotted lines indicate successive ±1 and 2-σ equivalent percentiles around the median.
and the limit of sin i < 1 giving Mc > 0.8 M⊙ and Mc > 0.278 M⊙ respectively, this results in Mp < 2.23 M⊙ and Mp < 1.72 M⊙ respectively. The blue lines represent the constraints derived from the nominal and ±1-σ limits of the orthometric amplitude of the Shapiro delay, h3. The orange lines designate the 2 and 3-σ upper limits derived for Ter5ap. The top panels depict the normalised 1-D pdfs for cos i, Mp and, on the side, Mc. The medians of the pdfs are depicted by the solid black lines, the dotted lines indicate successive ±1 and 2-σ equivalent percentiles around the median.
Current usage metrics show cumulative count of Article Views (full-text article views including HTML views, PDF and ePub downloads, according to the available data) and Abstracts Views on Vision4Press platform.
Data correspond to usage on the plateform after 2015. The current usage metrics is available 48-96 hours after online publication and is updated daily on week days.
Initial download of the metrics may take a while.