Fig. 7.
Download original image
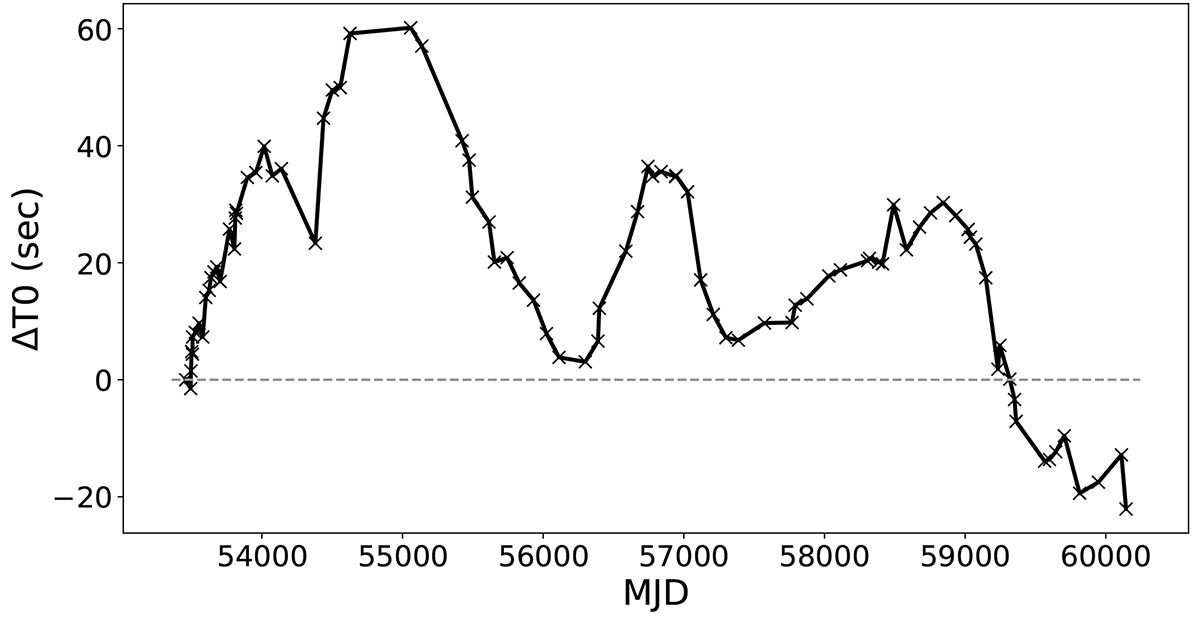
Significant orbital variability in Ter5ar demonstrated. The difference between expected and observed measurement of epoch of periastron (T0) is shown as a function of time in MJD. A stable orbit would show a flat horizontal line but the plot shows the variations ranging from –20 s to 60 s, thus demonstrating the difficulty in timing such systems.
Current usage metrics show cumulative count of Article Views (full-text article views including HTML views, PDF and ePub downloads, according to the available data) and Abstracts Views on Vision4Press platform.
Data correspond to usage on the plateform after 2015. The current usage metrics is available 48-96 hours after online publication and is updated daily on week days.
Initial download of the metrics may take a while.