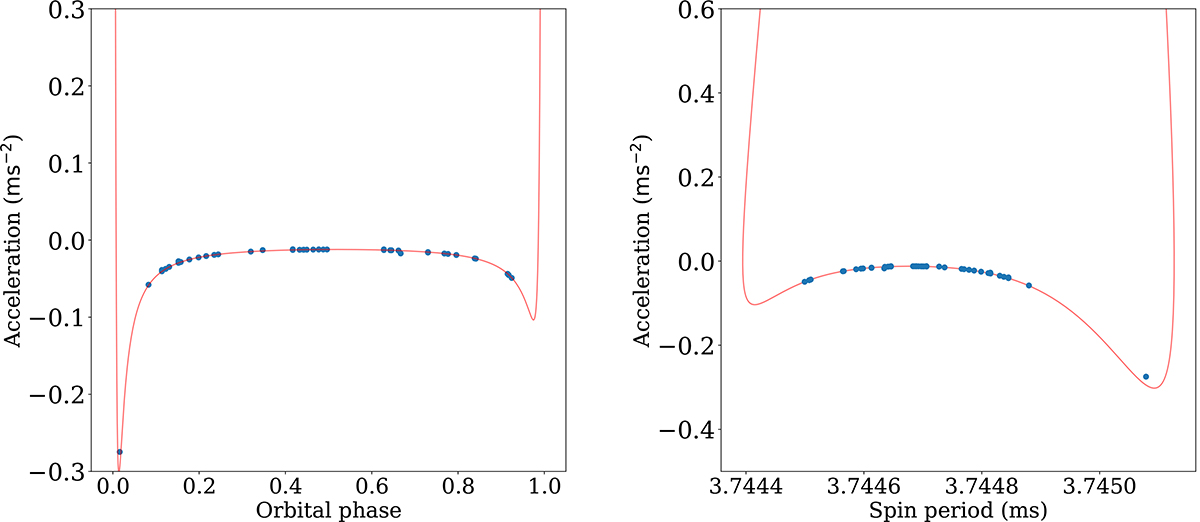
Fig. 6.
Download original image
Initial orbital solution for Ter5ap depicted. The left plot shows the line of sight acceleration as a function of orbital phase (which is in turn a function of the mean anomaly). The red line indicates the orbital solution model and the blue dots are data points. Note that the error bars on the data points are smaller than the marking symbol size. All points have a negative acceleration given that the pulsar spends very little time near periastron (roughly a day out of a 21.3 day orbital period). There are no positive acceleration data points which would better constrain the orbital solution. This is further demonstrated by showing the plot on the right depicting acceleration v/s the observed spin period. One data point clearly does not obey this initial solution.
Current usage metrics show cumulative count of Article Views (full-text article views including HTML views, PDF and ePub downloads, according to the available data) and Abstracts Views on Vision4Press platform.
Data correspond to usage on the plateform after 2015. The current usage metrics is available 48-96 hours after online publication and is updated daily on week days.
Initial download of the metrics may take a while.