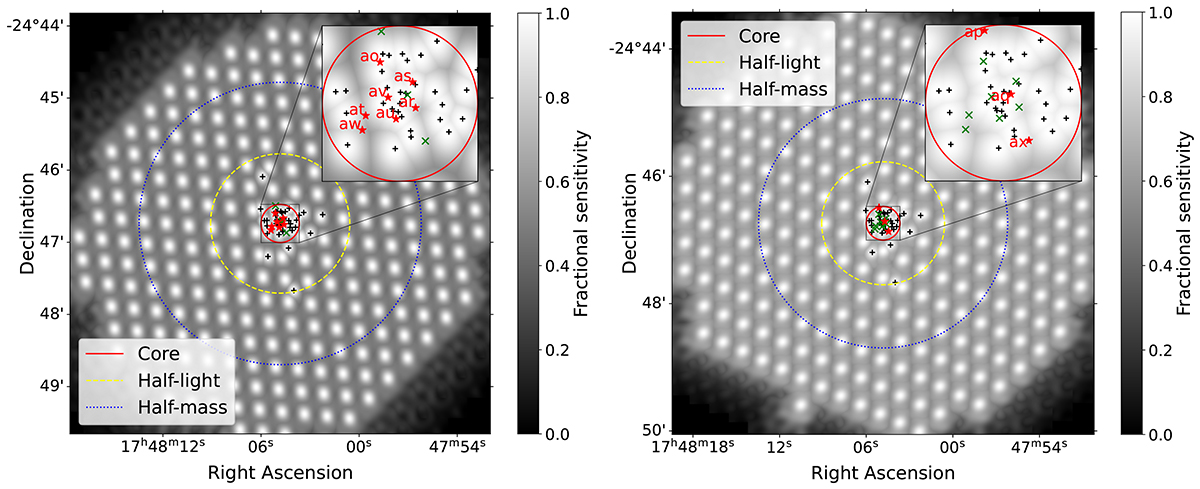
Fig. 1.
Download original image
TRAPUM beam tilings of the two search observations (Epoch 1 and Epoch 2; see text) of Ter5, performed with MeerKAT on 05 Sep 2020 (left) and on 06 Jan 2021 (right) at L-Band. There are 288 beams in total per observation. Each individual beam has been overlaid with the corresponding point spread function. The vertical bar shows the reference gray scale for the fractional sensitivity with reference to the boresight position of the individual beam. The different concentric circles indicate the core radius (red), half-light radius (yellow-dashed) and half-mass radius (blue dotted). The known pulsars are marked in each tiling as black crosses. The discoveries made in each epoch are denoted as red stars along with their individual names. The green crosses indicate the positions of the discoveries but from the alternate epoch where the discovery was first made. The positions of the discoveries comes from timing.
Current usage metrics show cumulative count of Article Views (full-text article views including HTML views, PDF and ePub downloads, according to the available data) and Abstracts Views on Vision4Press platform.
Data correspond to usage on the plateform after 2015. The current usage metrics is available 48-96 hours after online publication and is updated daily on week days.
Initial download of the metrics may take a while.