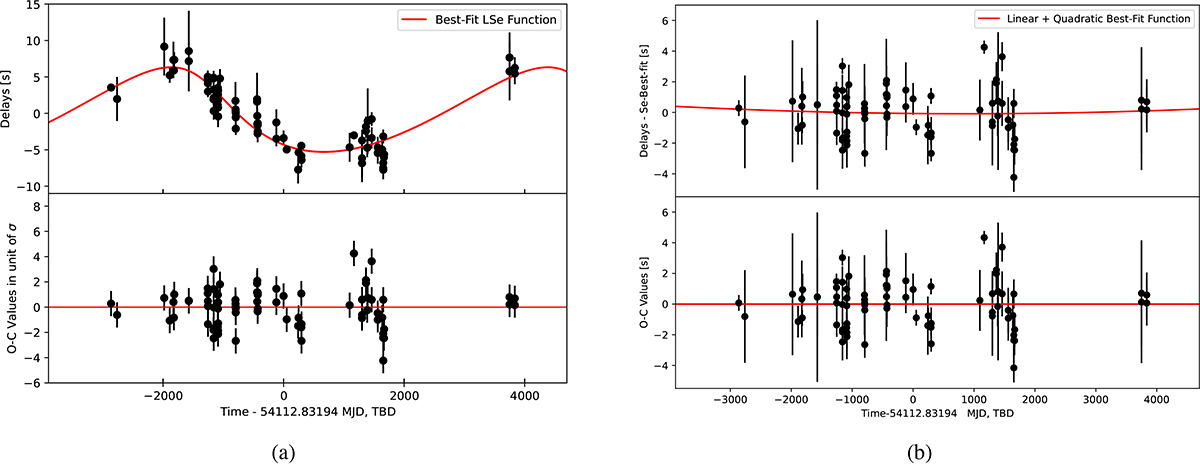
Fig. 2.
Download original image
Mid-eclipse time delays for different orbital solutions in units of seconds. (a) Time delays obtained by adopting T0 = 54112.831979 MJD for the reference time and P0 = 3.28106345 as the orbital period (top panel). The best-fit curve (red) is described in the text. O−C values are in units of σ (bottom panel). (b) Time delays obtained by subtracting the eccentric sinusoidal modulation (top panel). The best-fit curve is described by Eq. (2). Corresponding O−C values are in seconds (bottom panel).
Current usage metrics show cumulative count of Article Views (full-text article views including HTML views, PDF and ePub downloads, according to the available data) and Abstracts Views on Vision4Press platform.
Data correspond to usage on the plateform after 2015. The current usage metrics is available 48-96 hours after online publication and is updated daily on week days.
Initial download of the metrics may take a while.