Open Access
Fig. 7.
Download original image
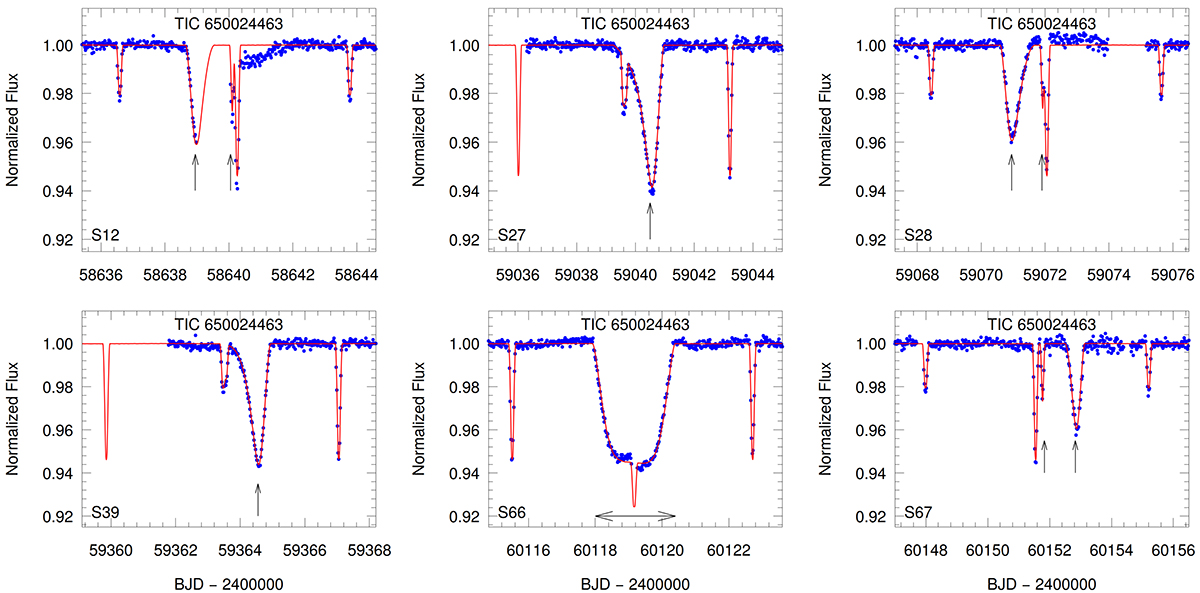
Light curves (blue points) and model fits (smooth red curves) for TIC 650024463. The vertical and horizontal arrows mark the times of third body eclipses. The other notation is the same as in Fig. 1.
Current usage metrics show cumulative count of Article Views (full-text article views including HTML views, PDF and ePub downloads, according to the available data) and Abstracts Views on Vision4Press platform.
Data correspond to usage on the plateform after 2015. The current usage metrics is available 48-96 hours after online publication and is updated daily on week days.
Initial download of the metrics may take a while.