Fig. 10.
Download original image
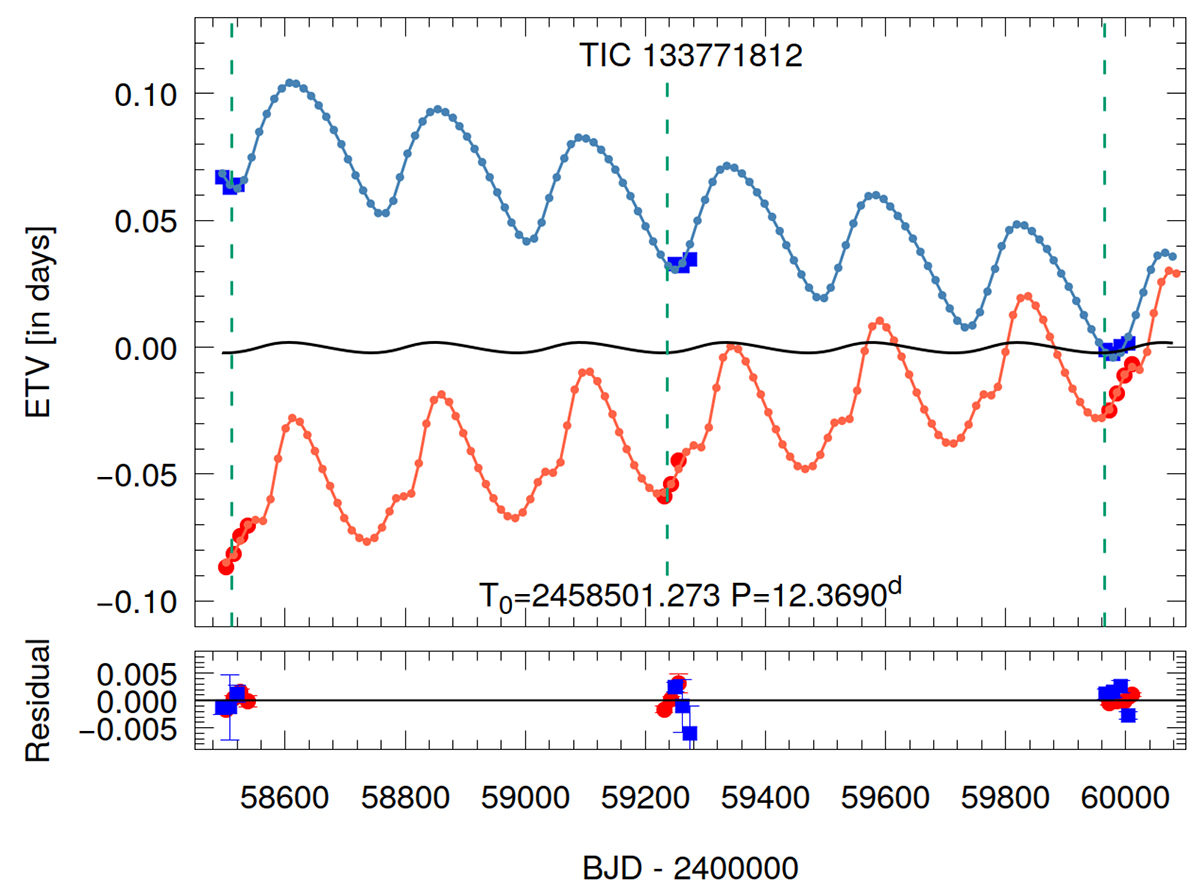
TESS primary and secondary ETV curves (red and blue circles, respectively), with the best-fit photodynamical solution (small red and blue points) for TIC 133771812 (see Sect. 6). The horizontally centered black curve represents the pure LTTE contribution. Vertical lines mark the times of the observed outer eclipses (dashed green-the binary occulting the tertiary star).
Current usage metrics show cumulative count of Article Views (full-text article views including HTML views, PDF and ePub downloads, according to the available data) and Abstracts Views on Vision4Press platform.
Data correspond to usage on the plateform after 2015. The current usage metrics is available 48-96 hours after online publication and is updated daily on week days.
Initial download of the metrics may take a while.