Open Access
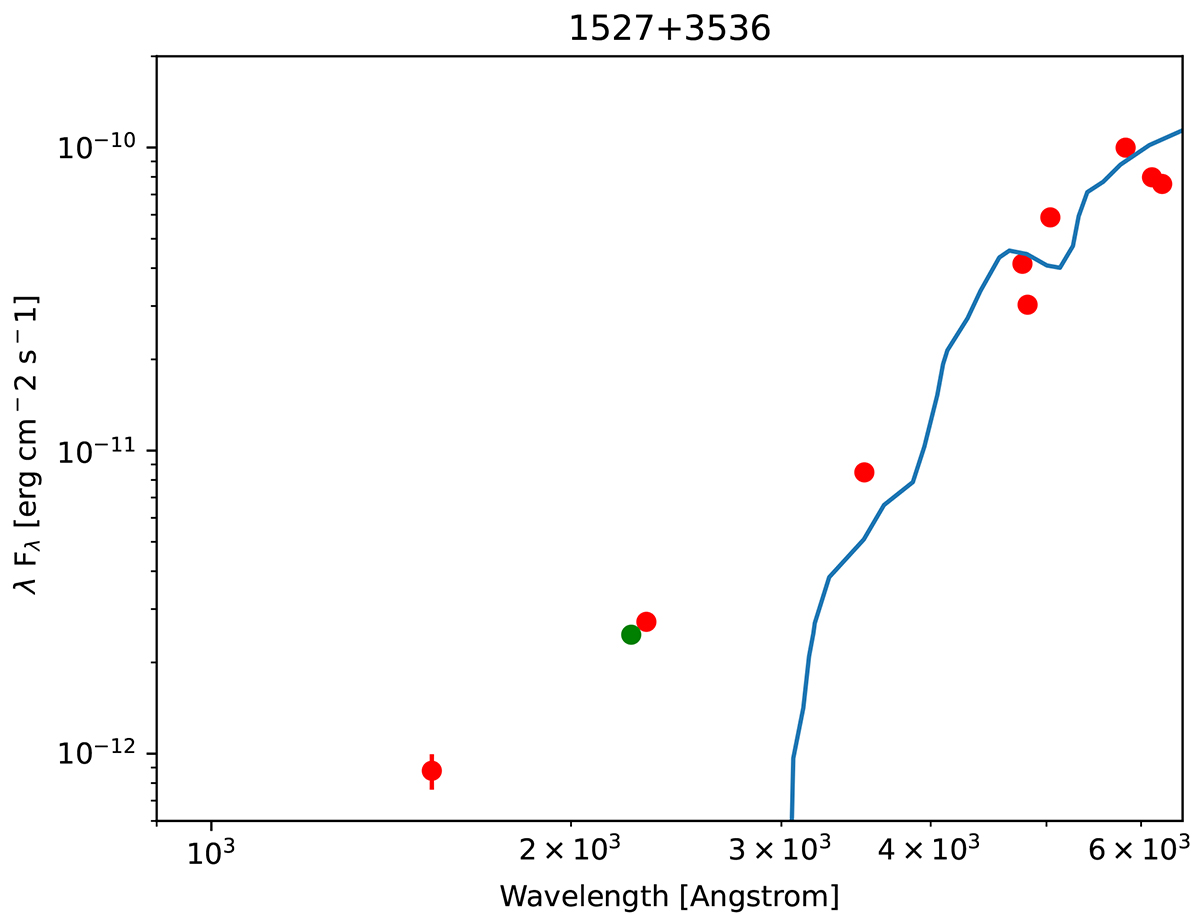
Fig. 1.
Download original image
Spectral energy distribution for 1527+3536. Red points are literature data from Vizier (GALEX, Gaia, SDSS, 2MASS, PAN-STARRS, WISE data). The green point is Swift UVOT data from our ToO campaign, and the blue line is the spectral fit of the main sequence companion star derived from Lin et al. (2023).
Current usage metrics show cumulative count of Article Views (full-text article views including HTML views, PDF and ePub downloads, according to the available data) and Abstracts Views on Vision4Press platform.
Data correspond to usage on the plateform after 2015. The current usage metrics is available 48-96 hours after online publication and is updated daily on week days.
Initial download of the metrics may take a while.