Fig. 8
Download original image
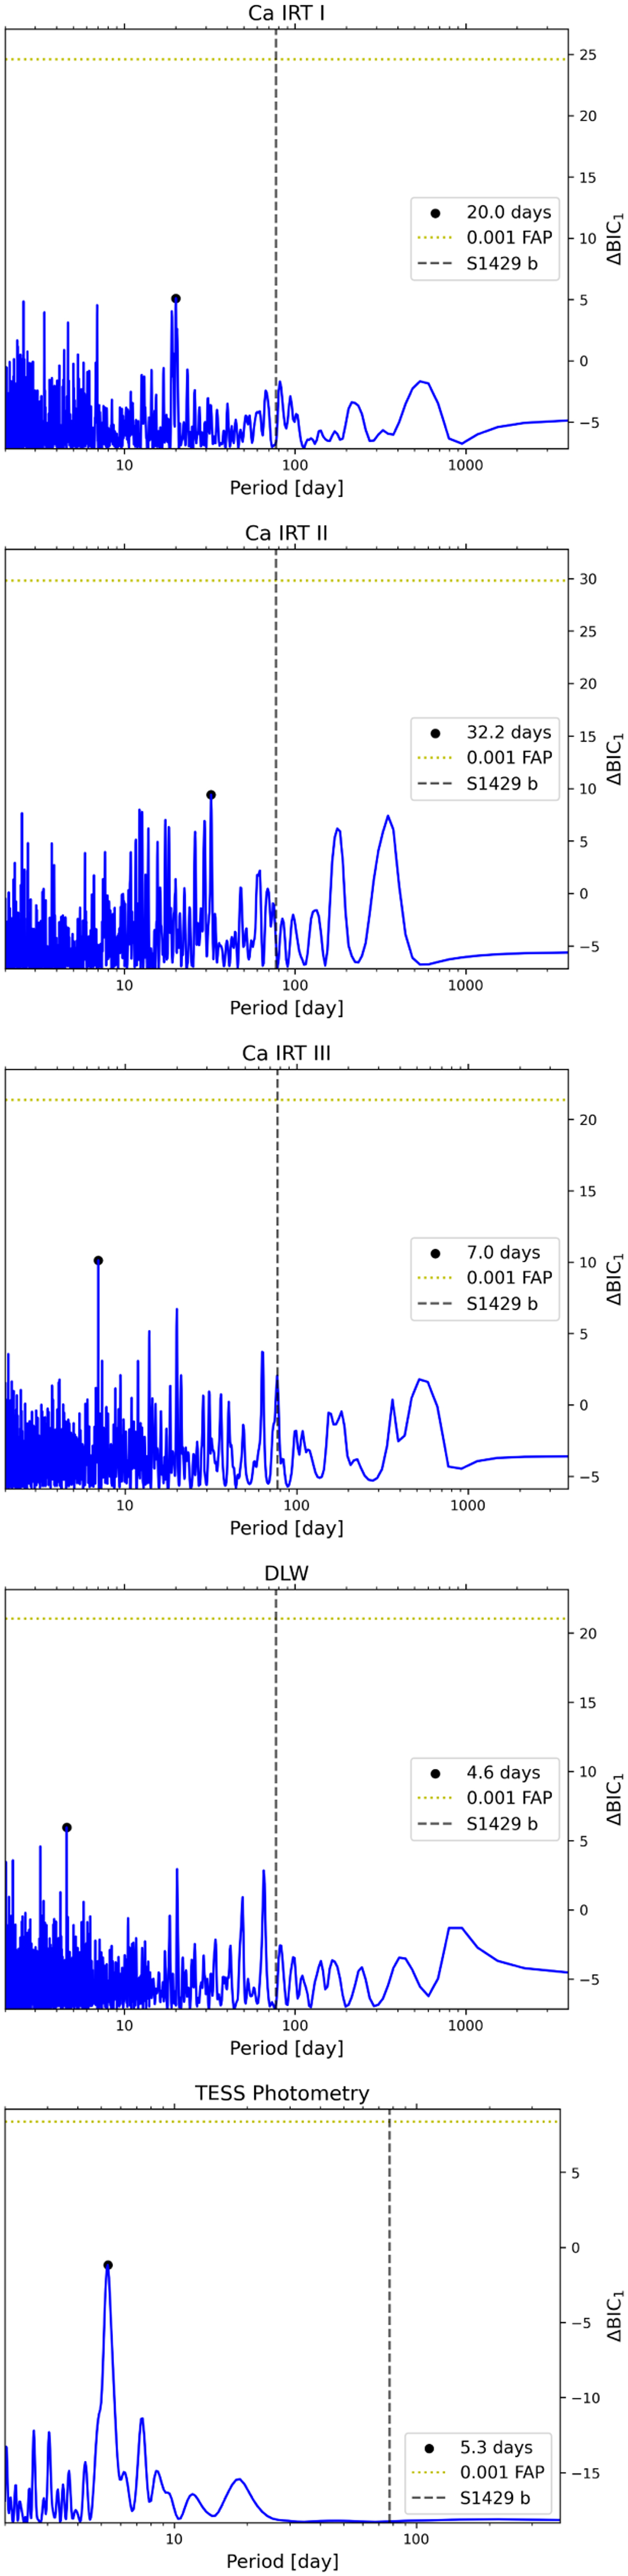
Periodograms of the activity indicators derived from the HPF spectra and the photometric data from TESS. The first three plots show the periodicity in the signals of the calcium triplet lines. The fourth and fifth panels show the periodograms for the differential line width from SERVAL and the TESS photometry, respectively. The horizontal yellow line indicates the 0.1% FAP threshold and the vertical black line shows the location of the potential planet signal in the RVs of S1429.
Current usage metrics show cumulative count of Article Views (full-text article views including HTML views, PDF and ePub downloads, according to the available data) and Abstracts Views on Vision4Press platform.
Data correspond to usage on the plateform after 2015. The current usage metrics is available 48-96 hours after online publication and is updated daily on week days.
Initial download of the metrics may take a while.