Fig. 2
Download original image
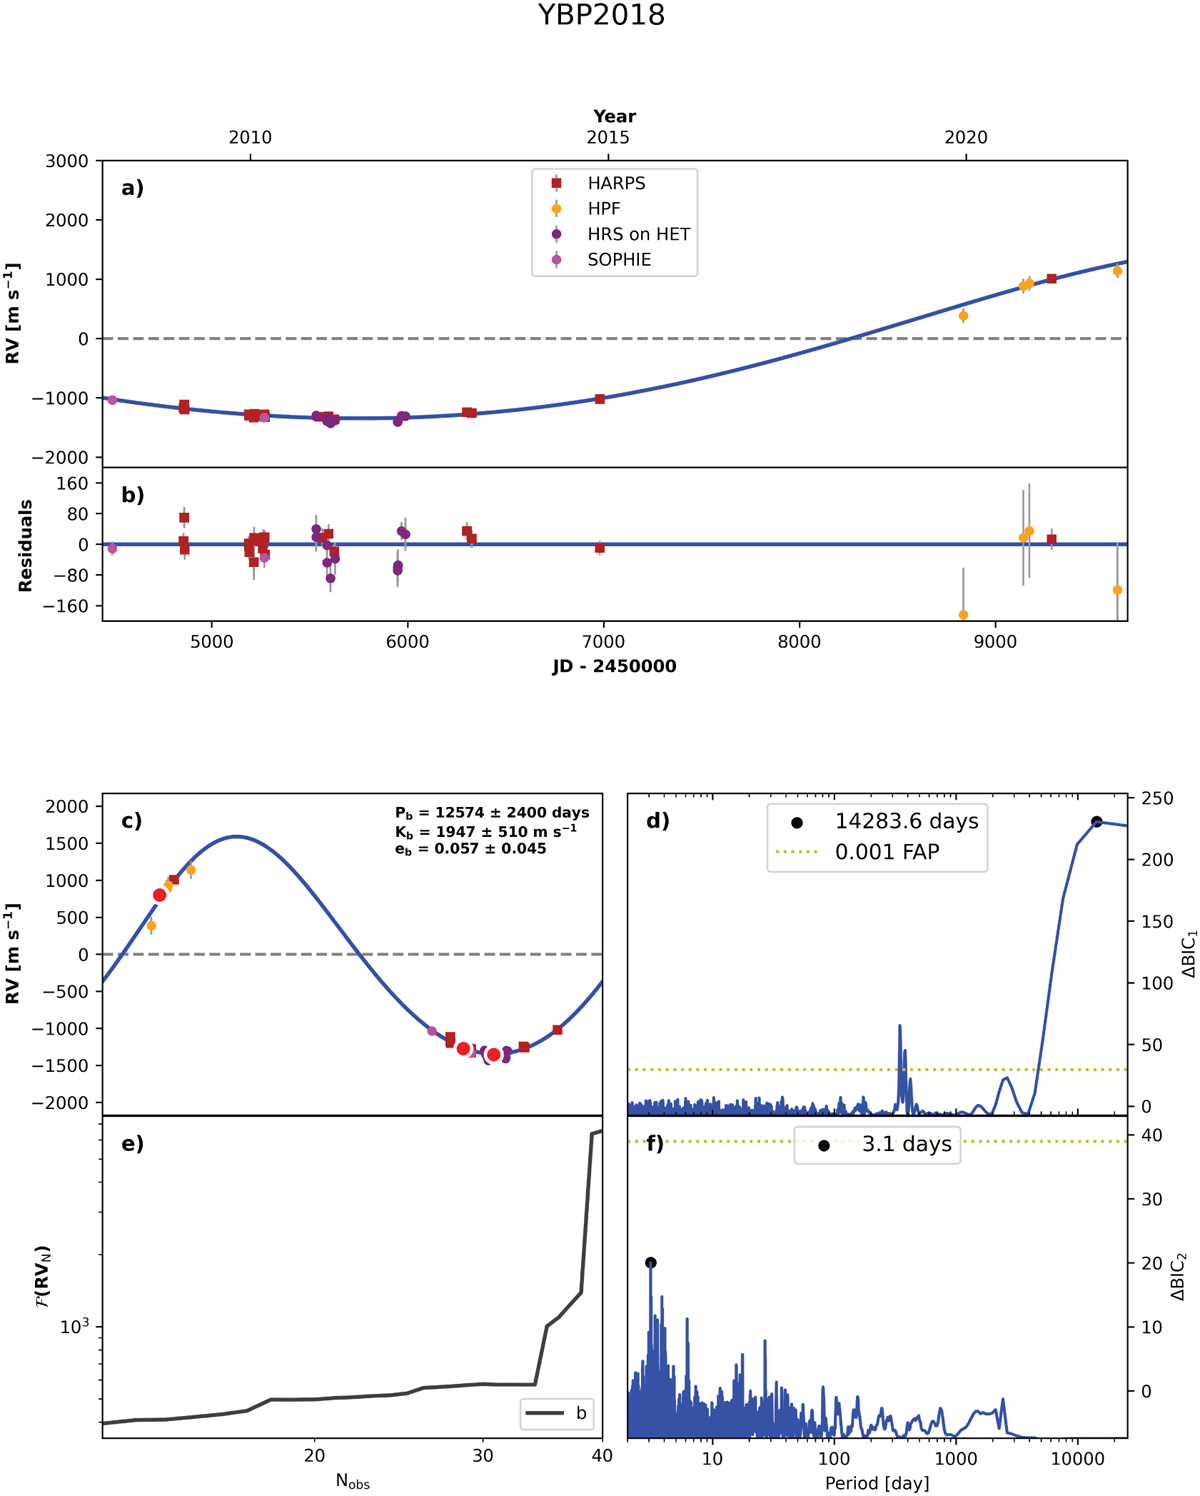
RVSearch summary plot for YBP 2018. Panel a shows the RV time-series with the best-fit model with the residuals shown in panel b. Datapoints labelled HRS are from the old high-resolution spectrograph installed at the HET. All of the RV observations are corrected to the zero point of HARPS and are therefore treated as coming from one instrument. Panel c shows the phase-folded RV curve with the values derived from the MCMC. Panels d and f show the periodogram of the one- and two-planet models and panel e plots the significance of the RV signal as a function of the number of observations.
Current usage metrics show cumulative count of Article Views (full-text article views including HTML views, PDF and ePub downloads, according to the available data) and Abstracts Views on Vision4Press platform.
Data correspond to usage on the plateform after 2015. The current usage metrics is available 48-96 hours after online publication and is updated daily on week days.
Initial download of the metrics may take a while.