Fig. 10
Download original image
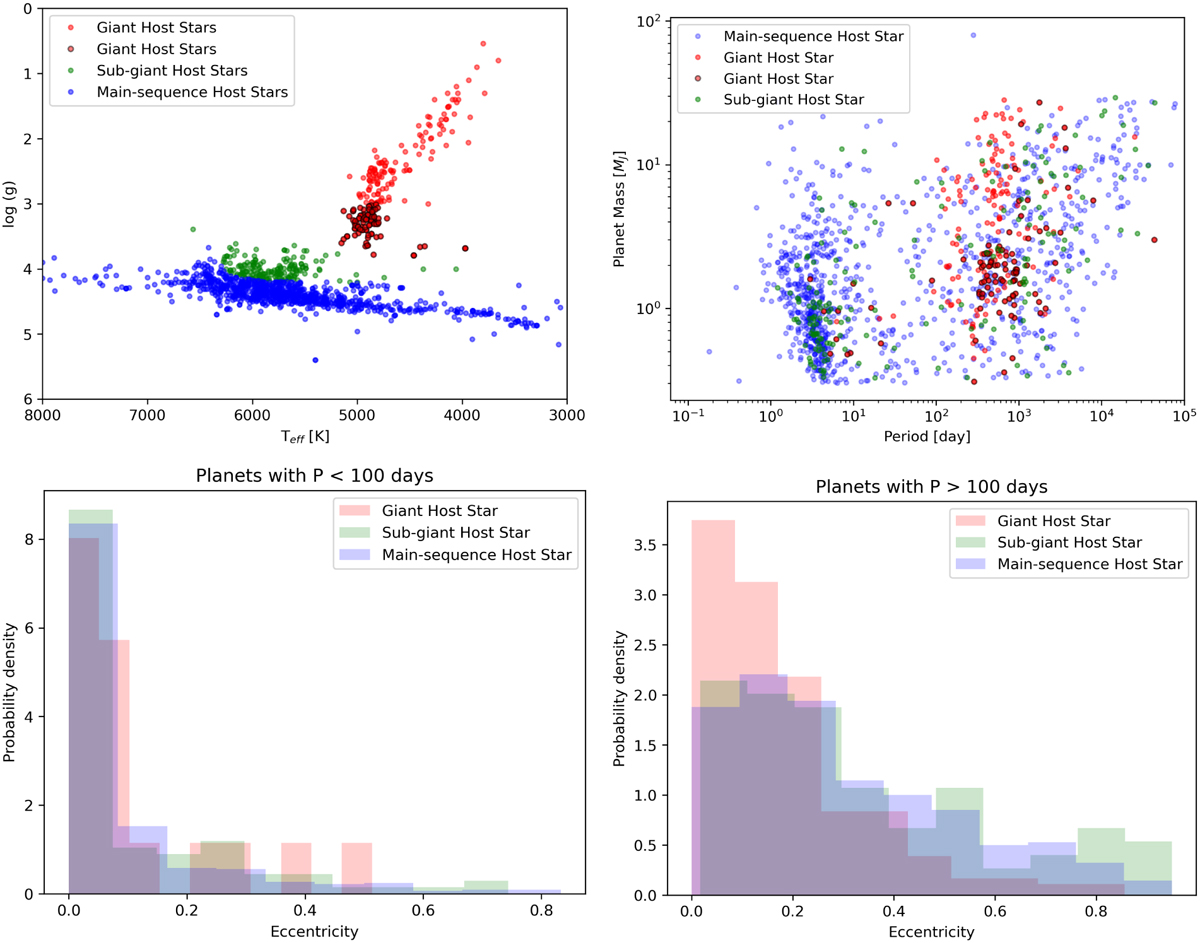
Giant planet population around stars at different evolutionary stages. Upper left: host stars of giant exoplanets (M sin i > 0.3 MJ) with either a true mass or M sin i measurement divided into their evolutionary stage. Red points are giant stars, green points are subgiants, and blue points are main sequence stars. Red points with black edges are giant stars at the beginning of their ascension up the red giant branch (log g > 3.0). Upper right: population of giant exoplanets in mass–period space sorted by the evolutionary stage of their host star. Lower: Eccentricity distribution of planets with periods shorter than 100 days (left) and larger than 100 days (right) orbiting main sequence, subgiant, and giant stars.
Current usage metrics show cumulative count of Article Views (full-text article views including HTML views, PDF and ePub downloads, according to the available data) and Abstracts Views on Vision4Press platform.
Data correspond to usage on the plateform after 2015. The current usage metrics is available 48-96 hours after online publication and is updated daily on week days.
Initial download of the metrics may take a while.