Fig. 1
Download original image
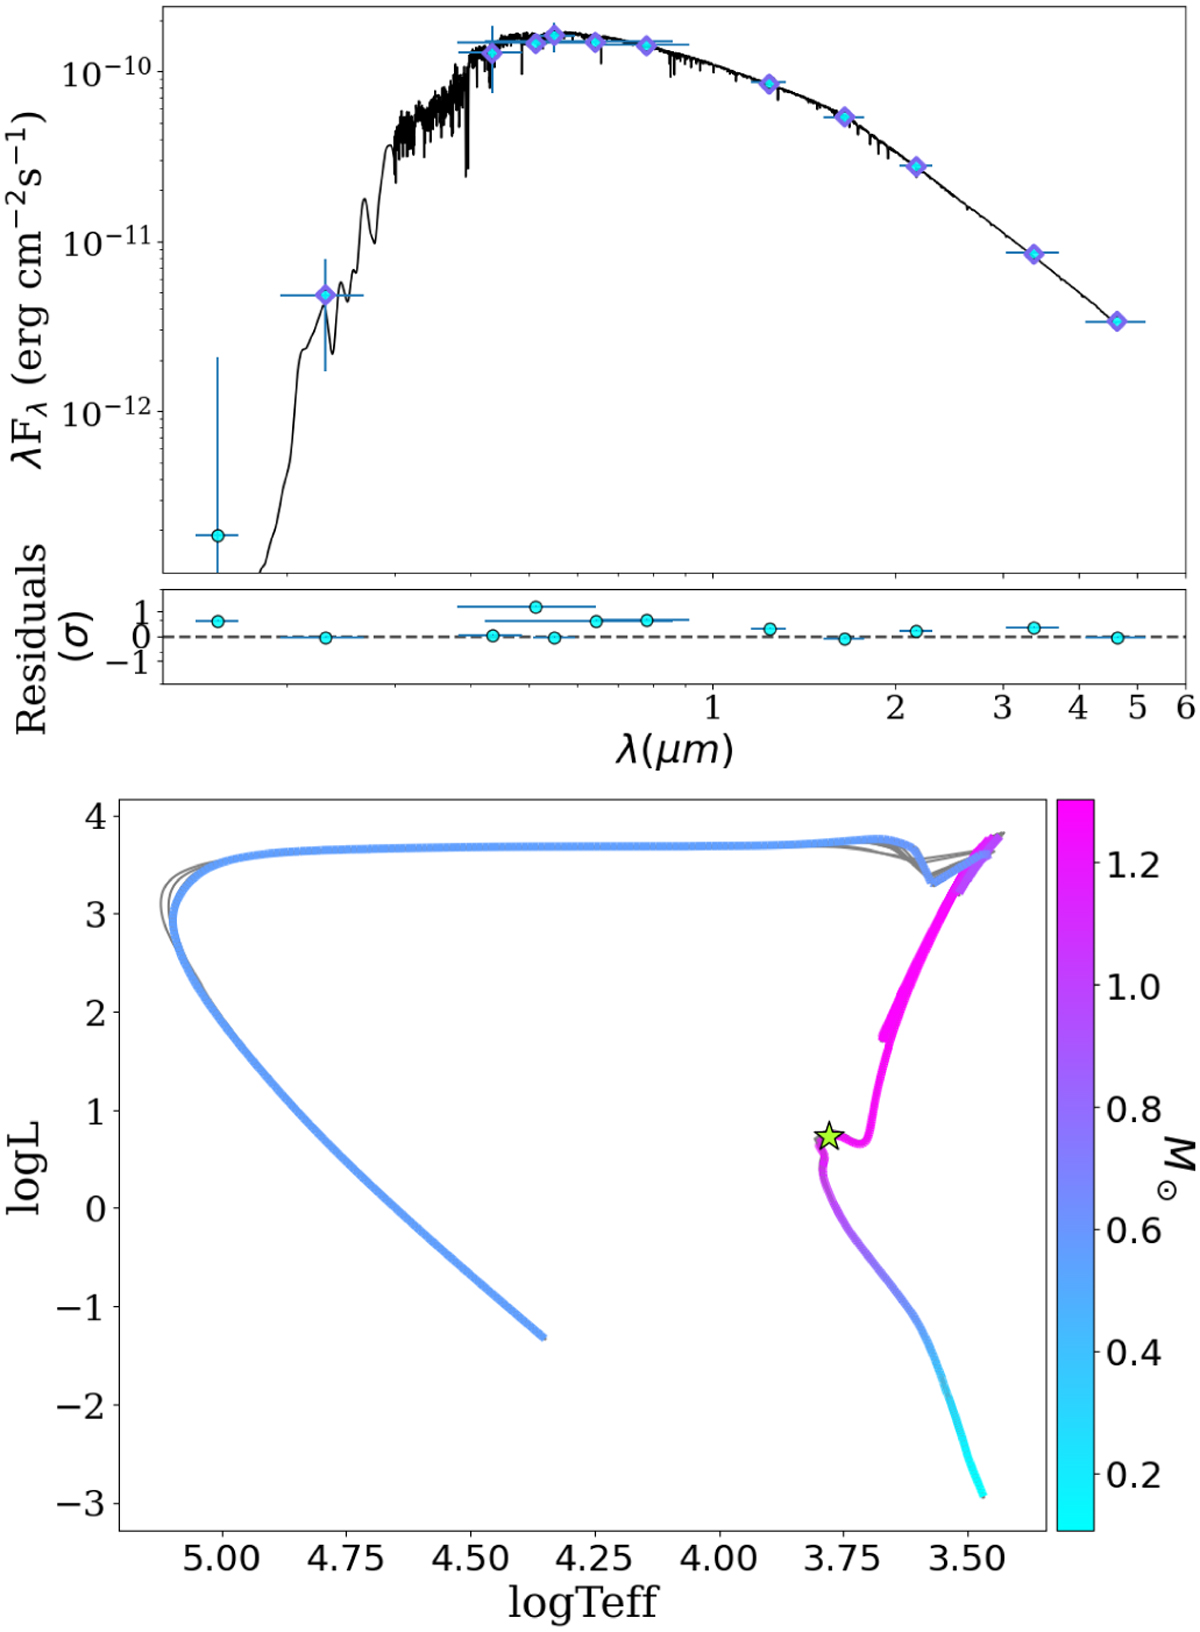
Stellar characterisation for one of the targets in our sample. Upper panel: SED fit for S1429. Datapoints in blue are flux values from available broadband photometry with the error in the x-axis direction corresponding to the passband of the filter and the y-error corresponding to the 1σ uncertainties of the flux. The best-fitting Phoenix model is plotted in black. Purple diamonds represent the flux value of the synthetic photometry from the Phoenix model in each passband. The residuals normalised to the errors of the photometry are shown below. Lower panel: isochrone fit for S1429.
Current usage metrics show cumulative count of Article Views (full-text article views including HTML views, PDF and ePub downloads, according to the available data) and Abstracts Views on Vision4Press platform.
Data correspond to usage on the plateform after 2015. The current usage metrics is available 48-96 hours after online publication and is updated daily on week days.
Initial download of the metrics may take a while.