Fig. 5
Download original image
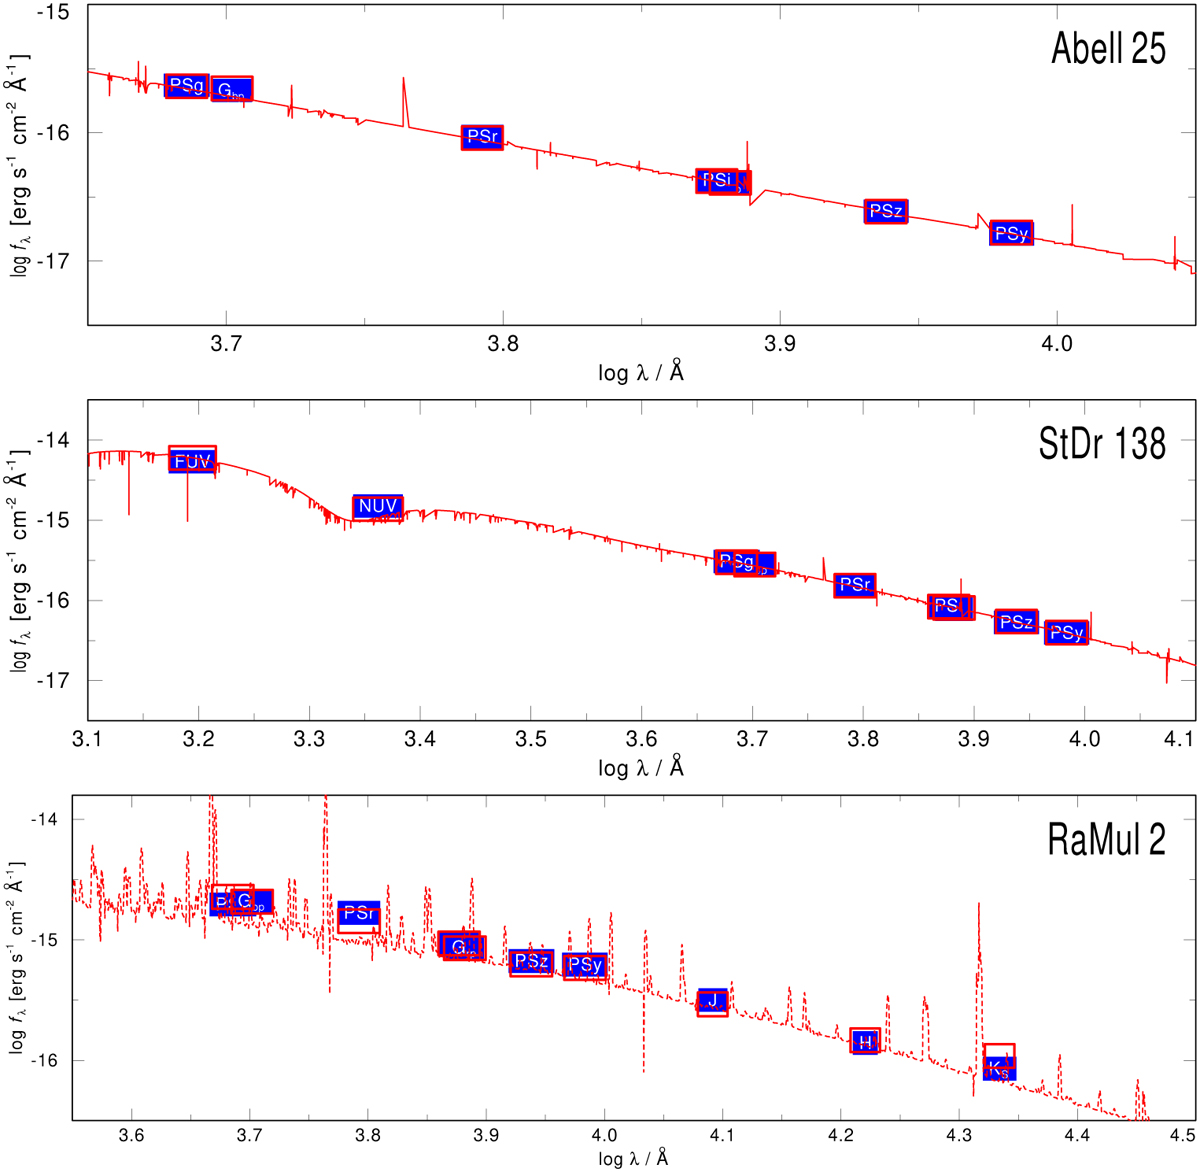
Spectral energy distributions of our three target stars. Observed photometry is shown by blue boxes and the spectrum of the best-fitting model by a red dashed line. Photometry is from GALEX (FUV and NUV), Gaia DR3 (Gbp), Pan-STARRS (PSg, PSr, PSi, PSz, Psy), and 2MASS (J, H, KS). For comparison the resulting photometric values from the models are also shown as red boxes.
Current usage metrics show cumulative count of Article Views (full-text article views including HTML views, PDF and ePub downloads, according to the available data) and Abstracts Views on Vision4Press platform.
Data correspond to usage on the plateform after 2015. The current usage metrics is available 48-96 hours after online publication and is updated daily on week days.
Initial download of the metrics may take a while.