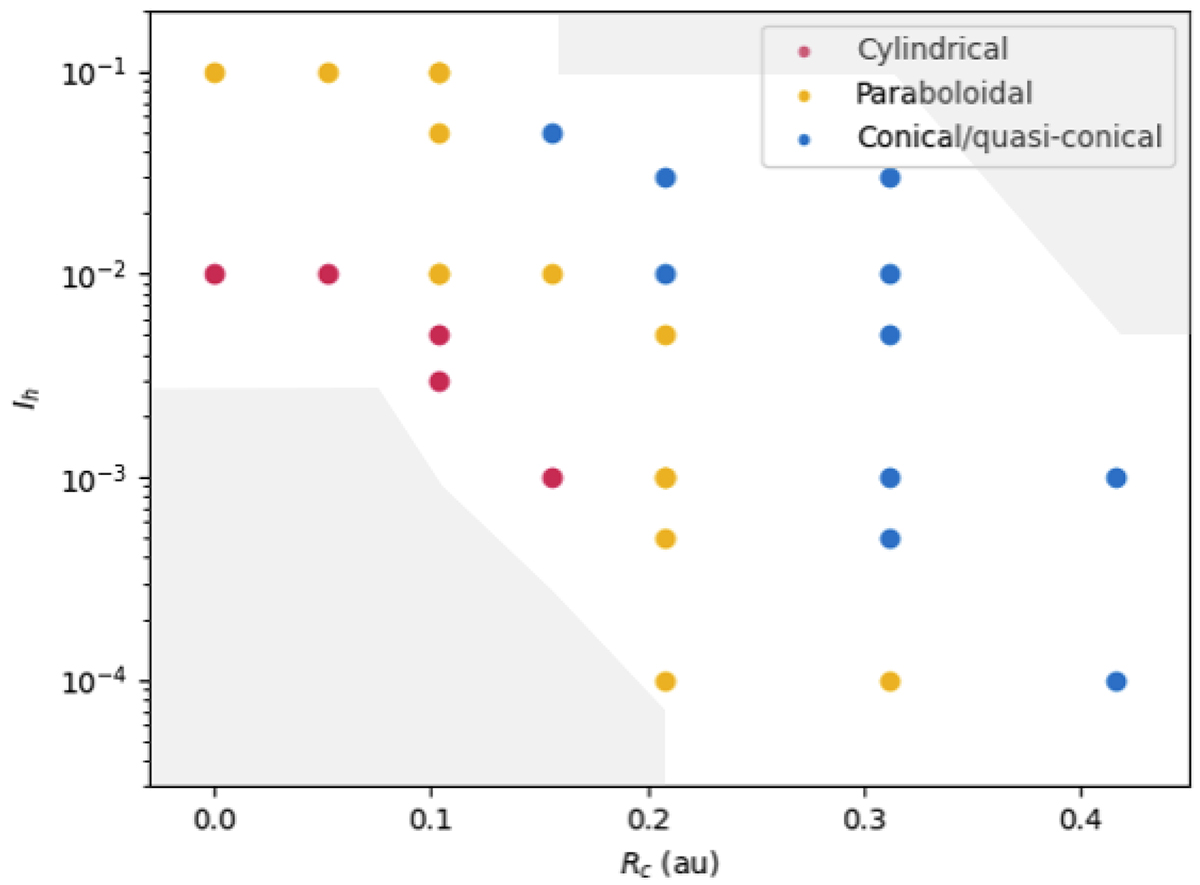
Fig. 5.
Download original image
Parameter space mapping the simulations performed. Each dot is a set of parameters. Red dots are cylindrical jets, yellow is for paraboloidal jets, finally the blue dots represent wide paraboloidal or conical solutions. The gray areas are parameter space zones not covered by MHD simulations because the code crashes systematically.
Current usage metrics show cumulative count of Article Views (full-text article views including HTML views, PDF and ePub downloads, according to the available data) and Abstracts Views on Vision4Press platform.
Data correspond to usage on the plateform after 2015. The current usage metrics is available 48-96 hours after online publication and is updated daily on week days.
Initial download of the metrics may take a while.