Fig. 2.
Download original image
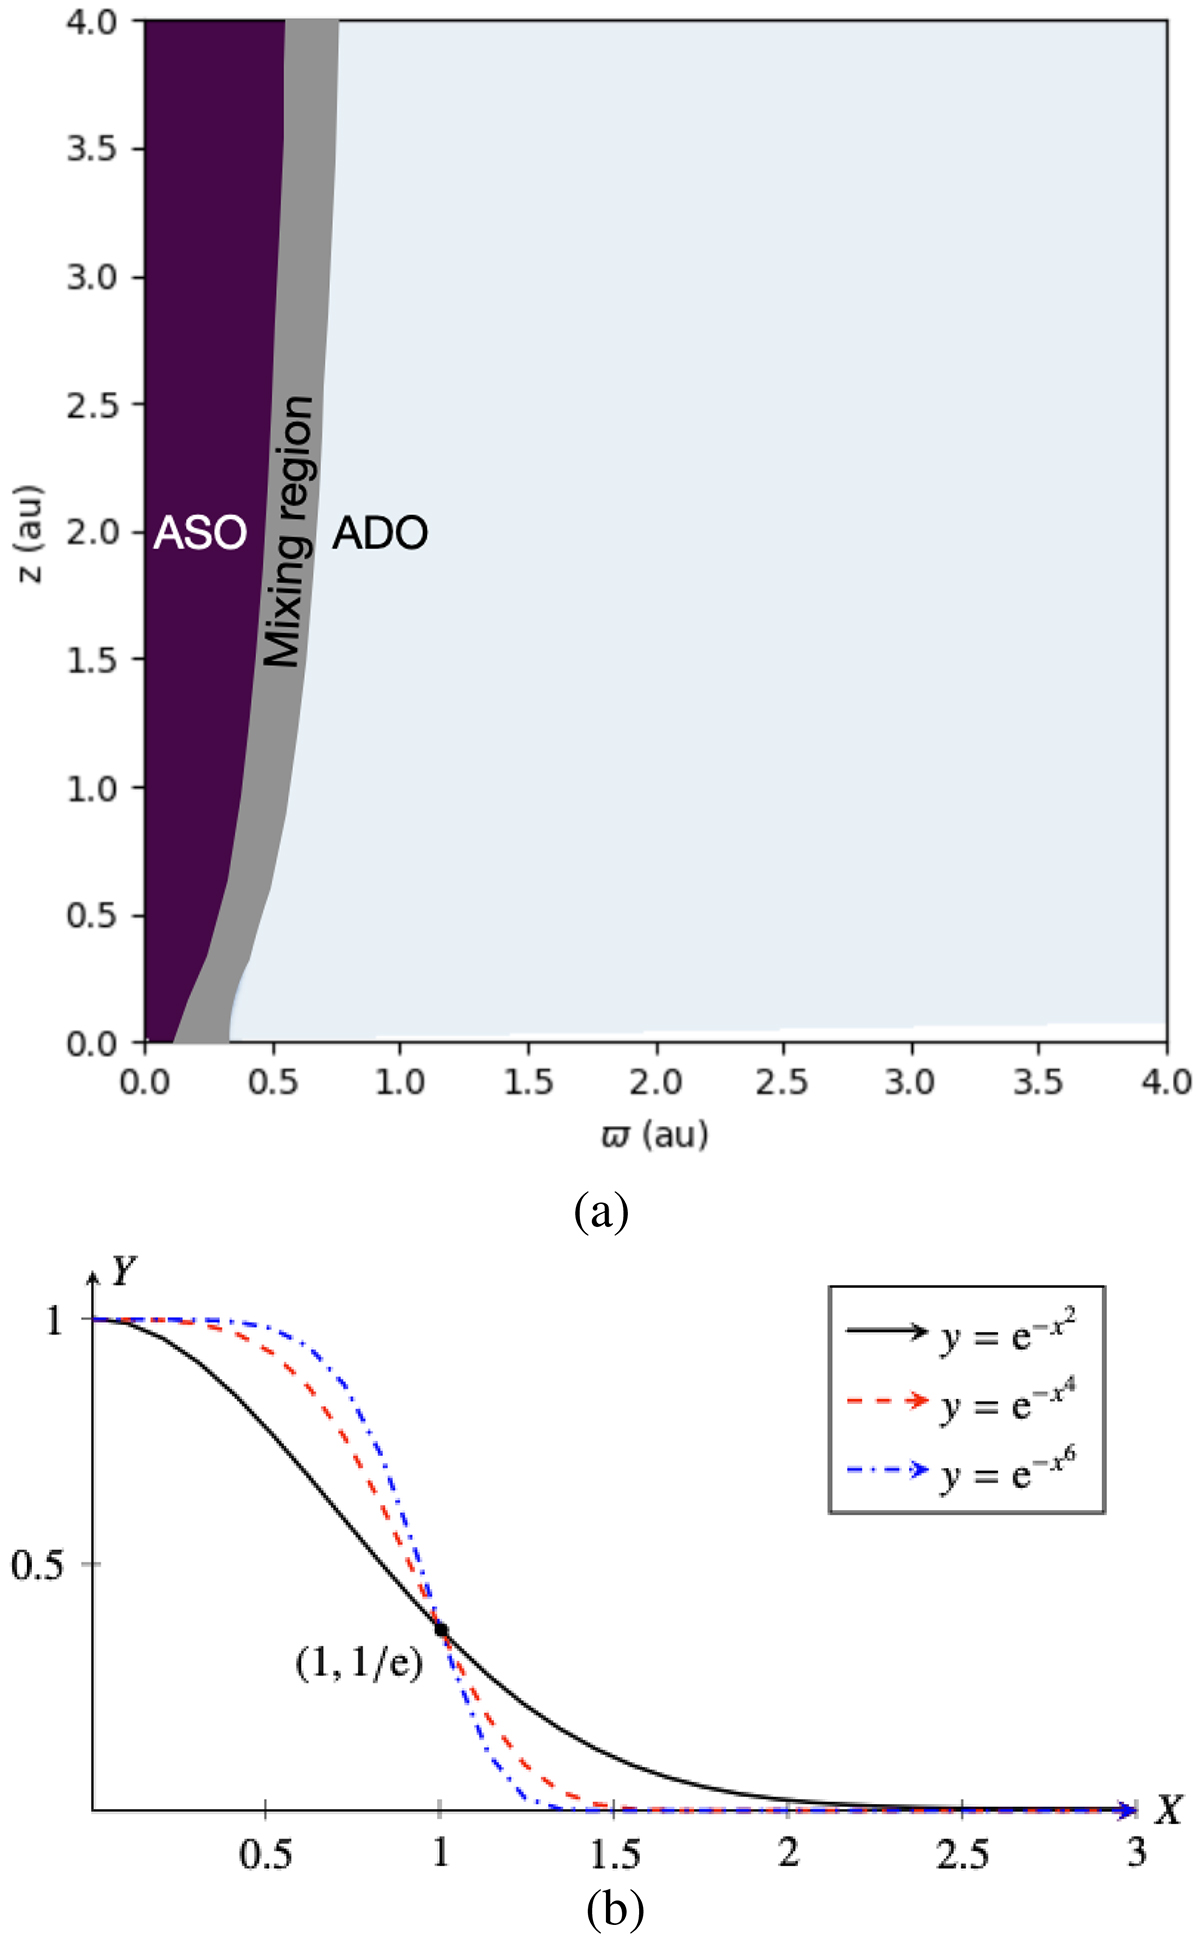
(a) The 2D map of the mixing function that goes from zero (blueish region) to one (purple region). ϖ is the cylindrical radius and z the rotational axis. The jet propagates along the z axis and ϖ is the cylindrical radius in the equatorial plane. A gray mask was added to better denote the mixing region. The speed of transition inside this region can be controlled through dm, as shown in (b). (b) Illustration of the extension of the ASO component over the selected region. The functions are of qualitative value. This shows the dependence of the parameter d on the mixing speed. We also shift the center of the function in this plot to zero. This allows for a better presentation of the mixing parameters.
Current usage metrics show cumulative count of Article Views (full-text article views including HTML views, PDF and ePub downloads, according to the available data) and Abstracts Views on Vision4Press platform.
Data correspond to usage on the plateform after 2015. The current usage metrics is available 48-96 hours after online publication and is updated daily on week days.
Initial download of the metrics may take a while.