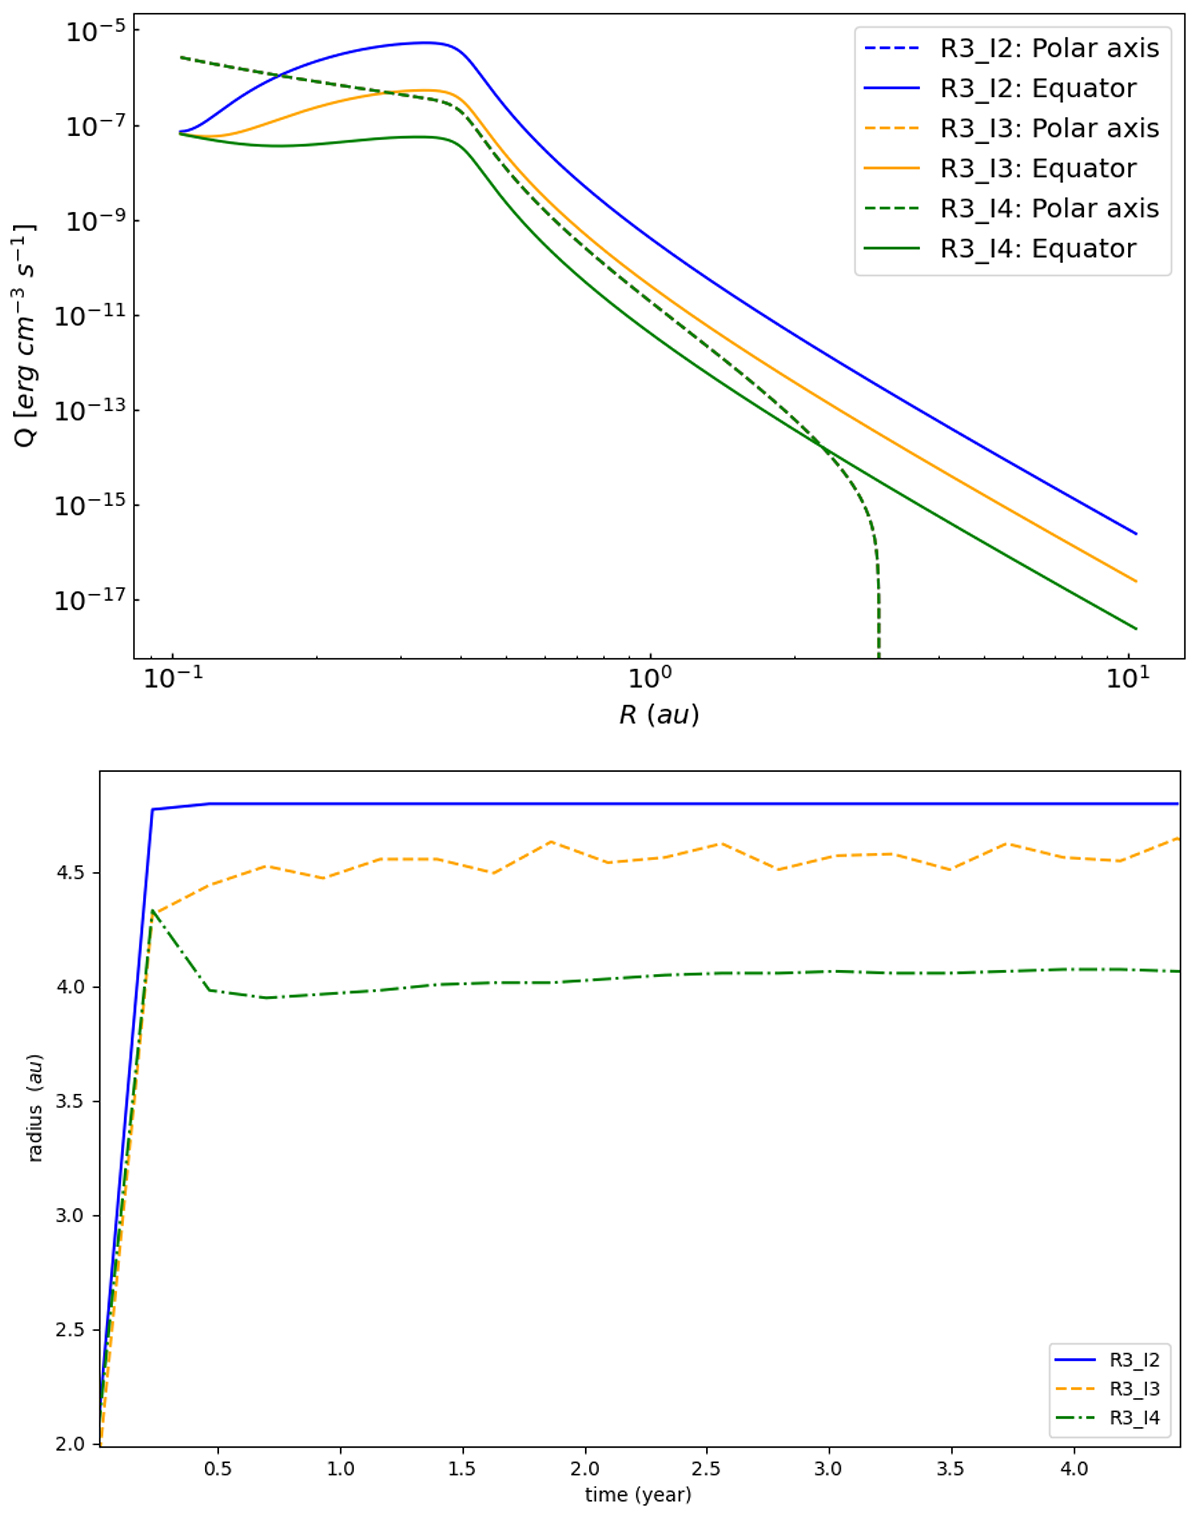
Fig. 10.
Download original image
Heating rates (upper plot) and the corresponding jet radius (lower plot) extracted from the simulations for a fixed Rc and a variable Ih. For all the cases, the stellar component is unchanged and matches the green dotted curve. In the upper plot, the dotted lines express the heating extracted at θ ∼ 0, and the solid lines are for values of the heating on the equator (θ ∼ π/2).
Current usage metrics show cumulative count of Article Views (full-text article views including HTML views, PDF and ePub downloads, according to the available data) and Abstracts Views on Vision4Press platform.
Data correspond to usage on the plateform after 2015. The current usage metrics is available 48-96 hours after online publication and is updated daily on week days.
Initial download of the metrics may take a while.