Fig. 7
Download original image
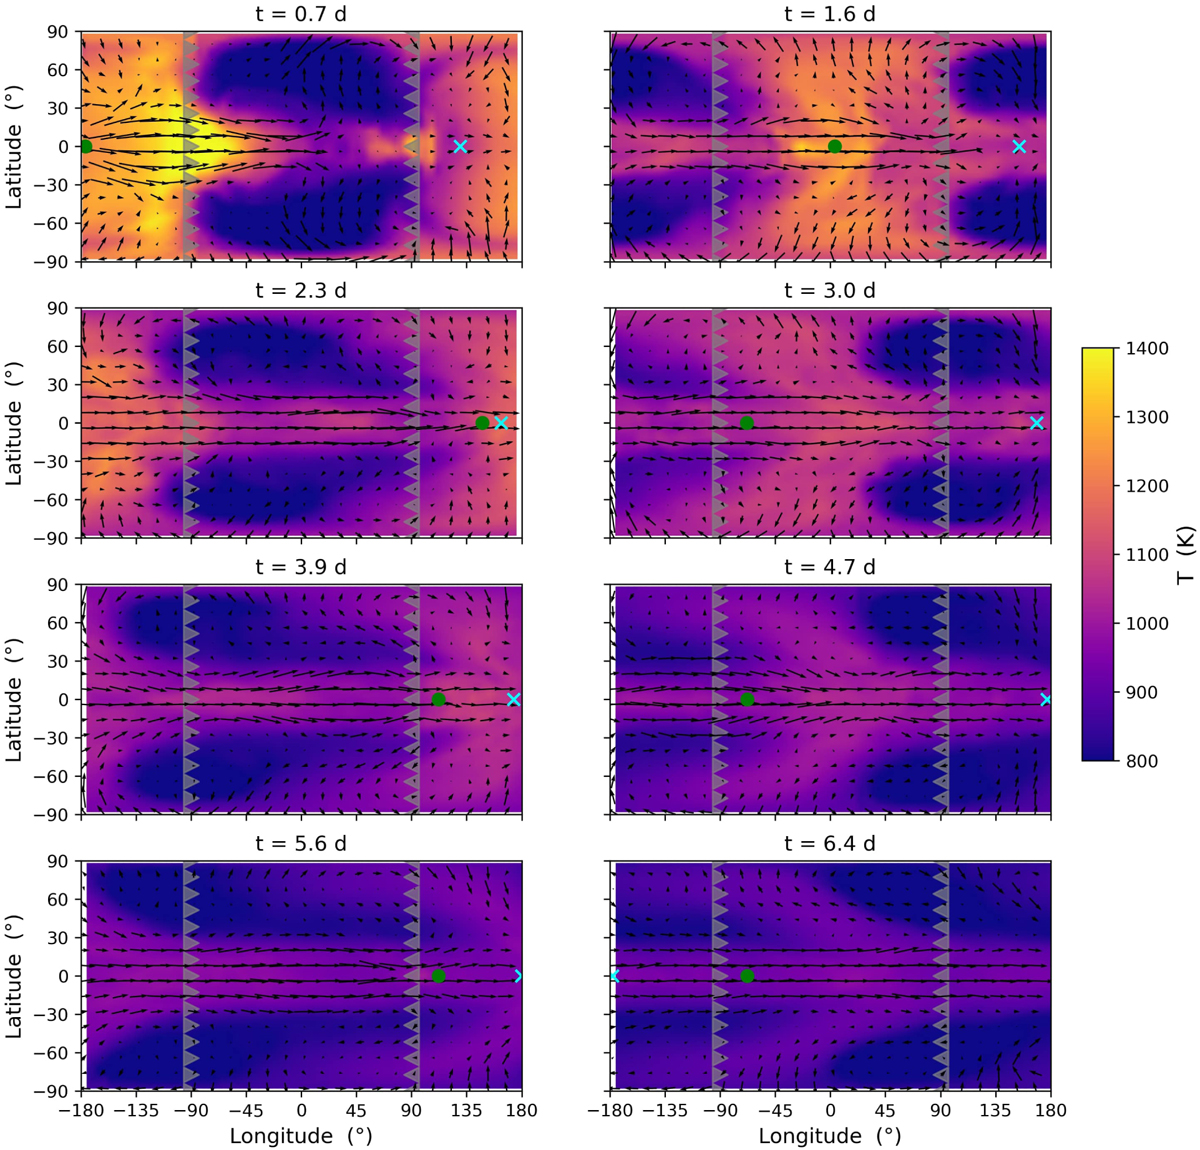
Horizontal slices of the temperature at 1 bar on HD 80606 b at different times after the periastron passage. The right panels correspond to observed emission maxima, and the left panels correspond to minima. Each panel is centred on the point below an observer on Earth, and grey triangles enclose the hemisphere in view, pointing towards the sub-observer point. Black arrows show the horizontal wind velocity. A cyan cross indicates the current substellar point and a green dot the substellar point at the periastron passage.
Current usage metrics show cumulative count of Article Views (full-text article views including HTML views, PDF and ePub downloads, according to the available data) and Abstracts Views on Vision4Press platform.
Data correspond to usage on the plateform after 2015. The current usage metrics is available 48-96 hours after online publication and is updated daily on week days.
Initial download of the metrics may take a while.