Fig. 4
Download original image
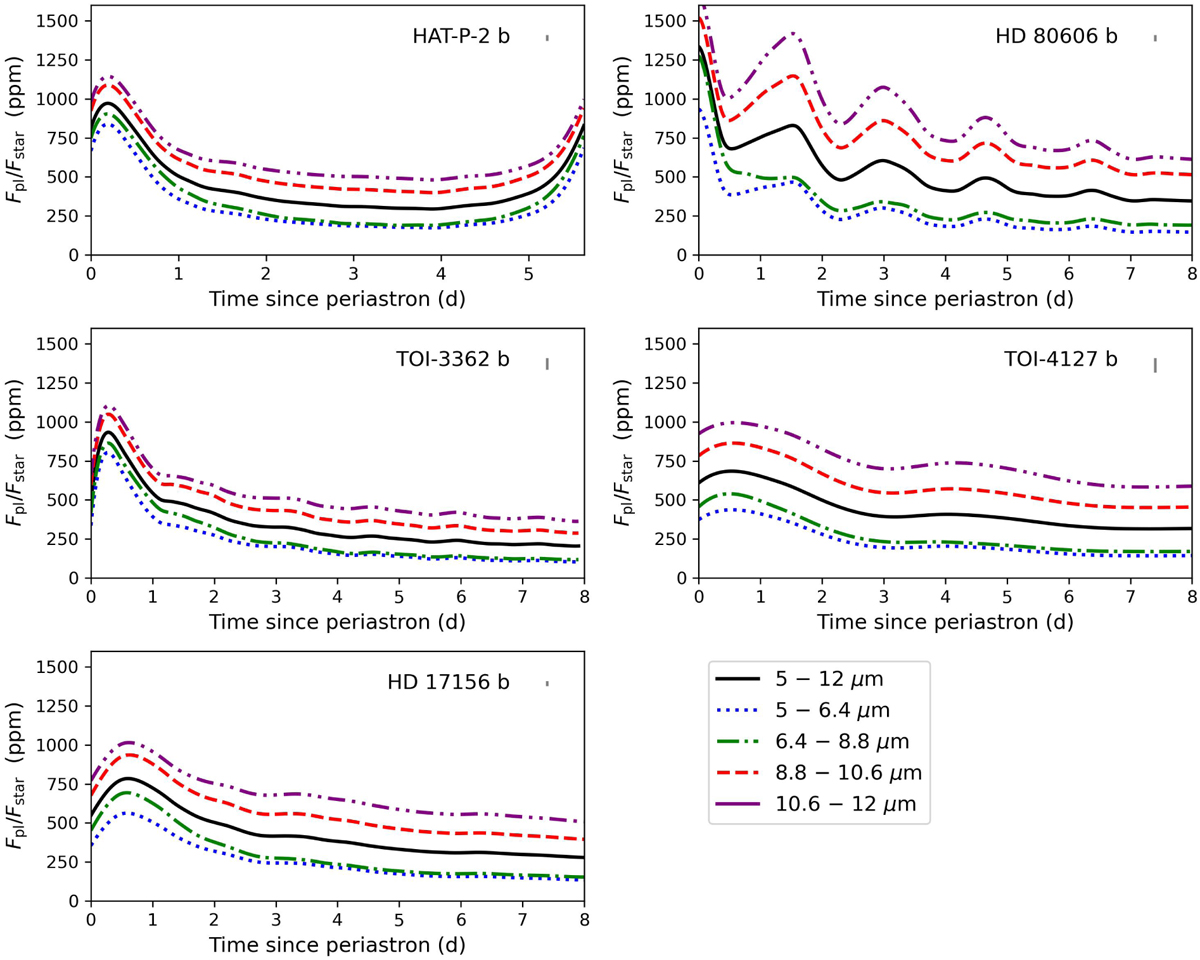
Synthetic light curves of all five planets relative to the brightness of the parent star in different wavelength ranges. We show the eight days after the periastron passage, except for HAT-P-2 b because of its short orbital period. A vertical grey line in the top right indicates the typical MIRI LRS precision when using the full 5–12 µm range for a star of that visual magnitude. Ringing is seen as the local maxima in the light curves of HD 80606 b and TOI-4127 b, which is especially pronounced at longer wavelengths. HD 17156 b also displays a local maximum after the periastron peak in the long wavelength regimes.
Current usage metrics show cumulative count of Article Views (full-text article views including HTML views, PDF and ePub downloads, according to the available data) and Abstracts Views on Vision4Press platform.
Data correspond to usage on the plateform after 2015. The current usage metrics is available 48-96 hours after online publication and is updated daily on week days.
Initial download of the metrics may take a while.