Open Access
Fig. 1.
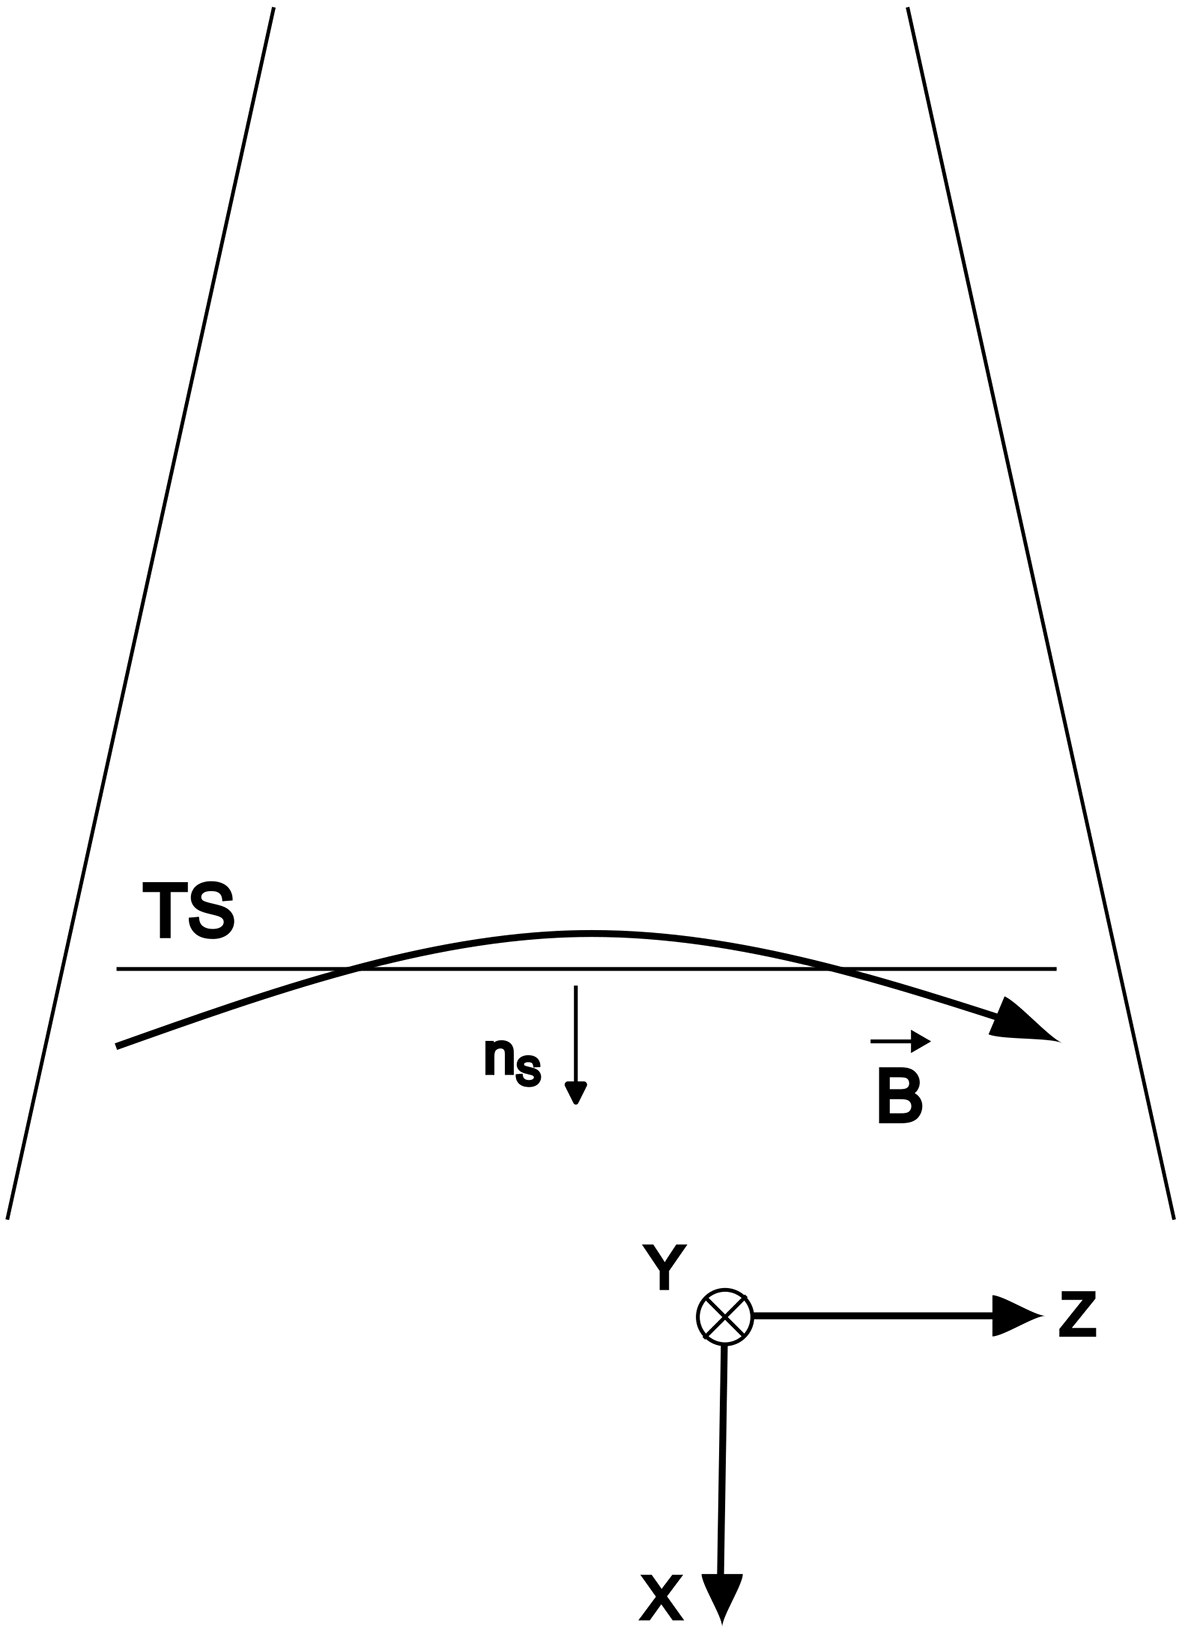
Download original image
Sketch of the magnetic reconnection outflow region with the TS. The upstream and downstream regions of the TS are located above and below the TS, respectively. The coordinate system employed in the paper is also drawn.
Current usage metrics show cumulative count of Article Views (full-text article views including HTML views, PDF and ePub downloads, according to the available data) and Abstracts Views on Vision4Press platform.
Data correspond to usage on the plateform after 2015. The current usage metrics is available 48-96 hours after online publication and is updated daily on week days.
Initial download of the metrics may take a while.