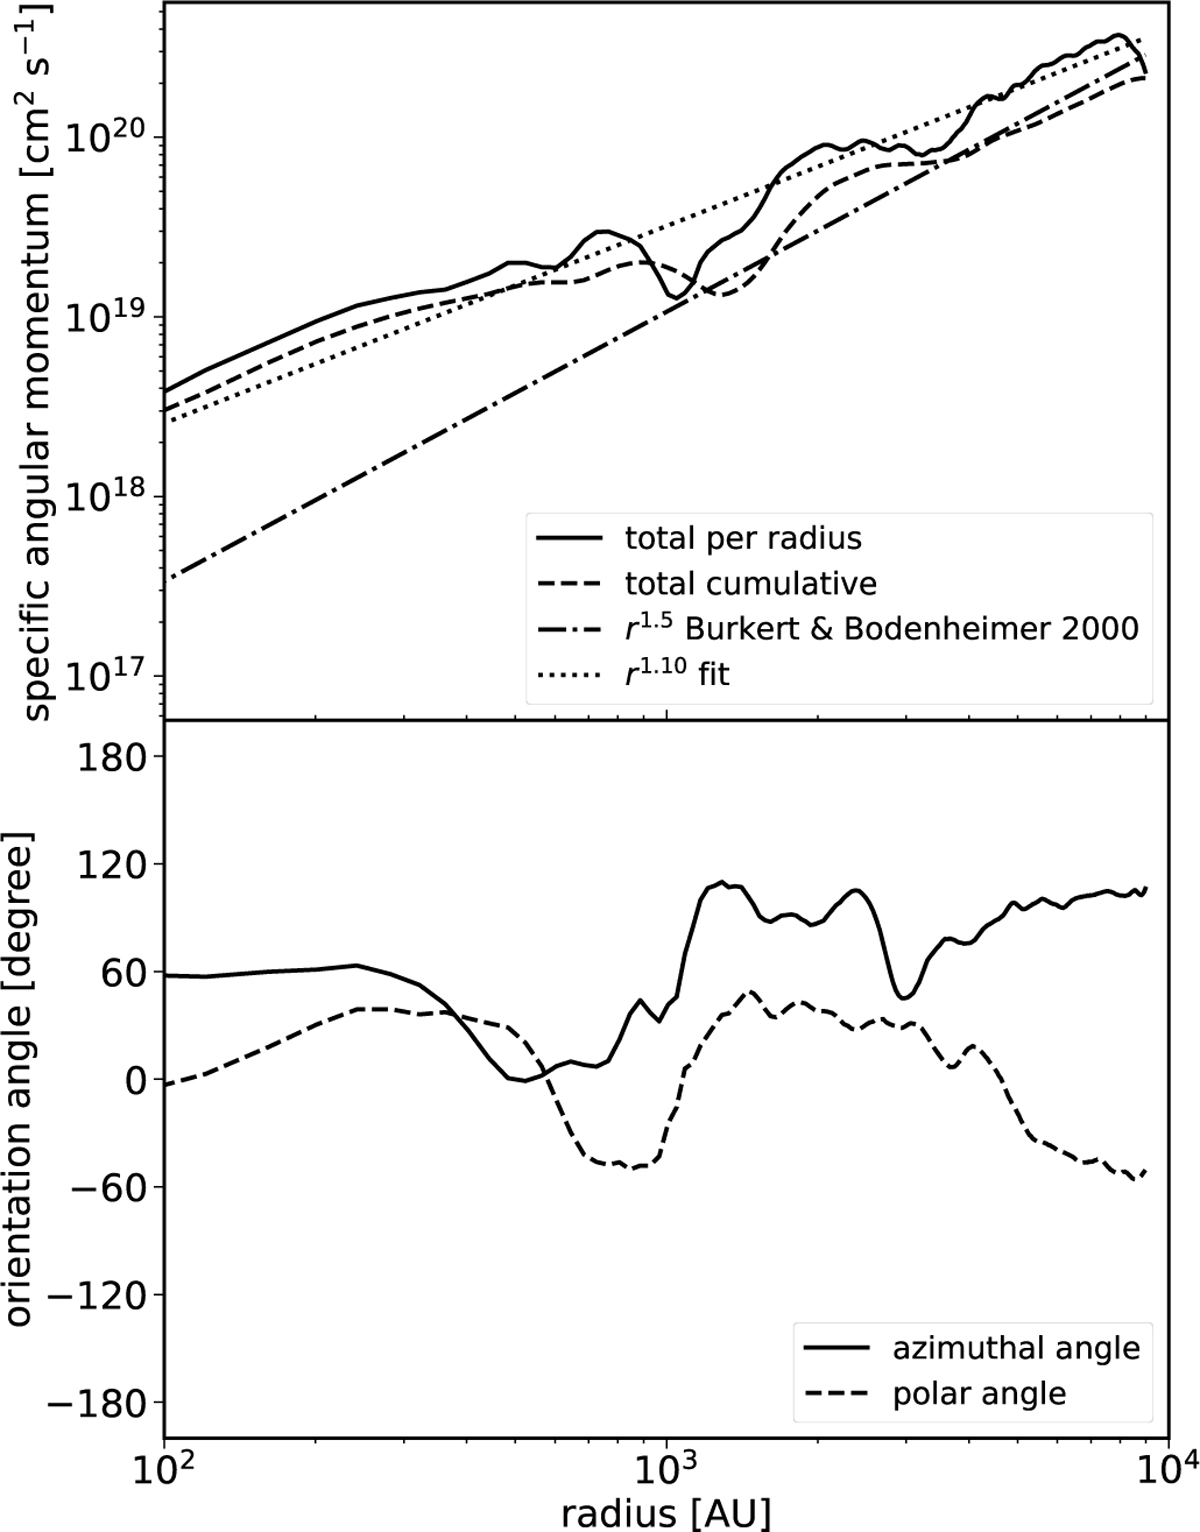
Fig. 5
Download original image
Total specific angular momentum of the forming core and its orientation 93.2 kyr before collapse. The upper panel shows the angular momentum of each radial shell as solid line as well as the cumulative total angular momentum up to that radius as dashed lines. We fitted a slope to the former which shows that they both follow a close to linear trend given by the dotted line. We also plot the predicted slope for turbulent cores by Burkert & Bodenheimer (2000) as the dashed-dotted line. The lower panel shows the orientation of the total specific angular momentum vector of each radial shell.
Current usage metrics show cumulative count of Article Views (full-text article views including HTML views, PDF and ePub downloads, according to the available data) and Abstracts Views on Vision4Press platform.
Data correspond to usage on the plateform after 2015. The current usage metrics is available 48-96 hours after online publication and is updated daily on week days.
Initial download of the metrics may take a while.