Fig. 4
Download original image
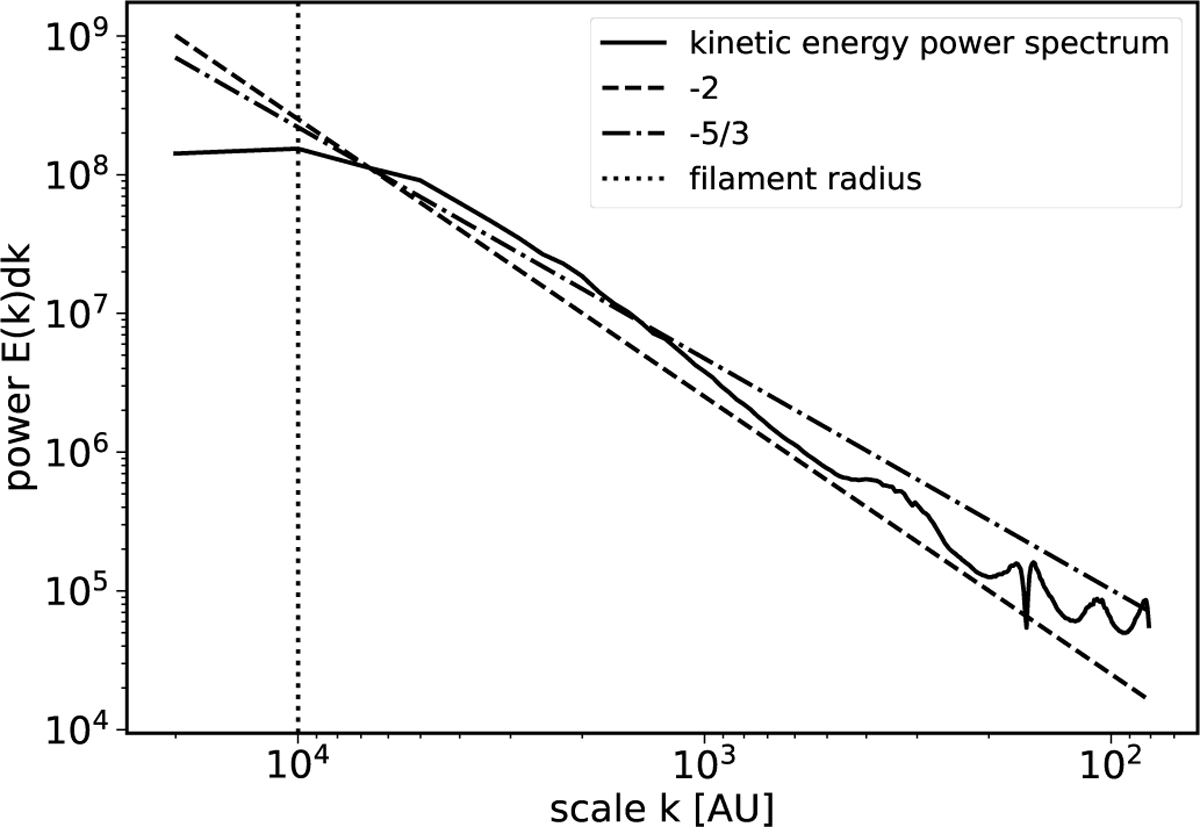
Kinetic energy power spectrum centred around the core. The dashed line shows the expectation for subsonic turbulence given by Kolmogorov’s theory and the dashed-dotted line the expectation for supersonic turbulence given by Burger’s turbulence. The vertical dotted line shows the scale of the radial extent of the filament at the core position.
Current usage metrics show cumulative count of Article Views (full-text article views including HTML views, PDF and ePub downloads, according to the available data) and Abstracts Views on Vision4Press platform.
Data correspond to usage on the plateform after 2015. The current usage metrics is available 48-96 hours after online publication and is updated daily on week days.
Initial download of the metrics may take a while.