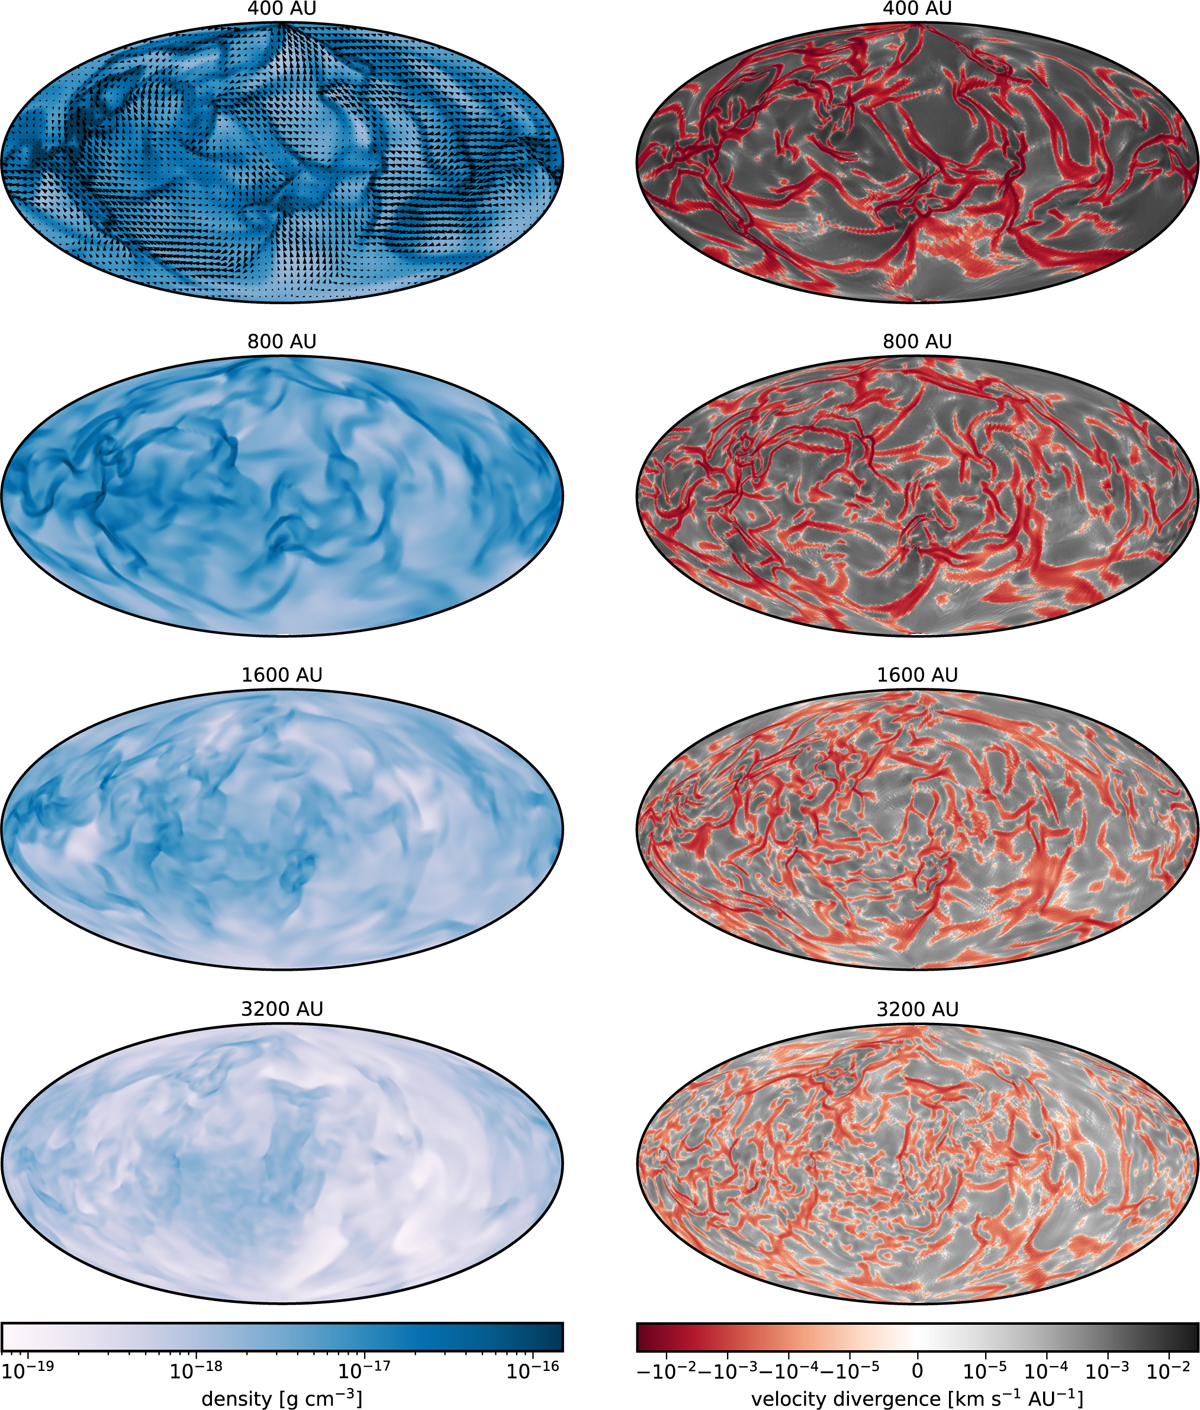
Fig. 12
Download original image
Hammer projections of the density and velocity divergence at different distances for the same time step. From top to bottom: we show larger and larger radii. The top left panel shows the same density as given in Fig. 7 together with the respective velocity vectors indicating the direction and magnitude of the motions perpendicular to the infall. This velocity field defines the velocity divergence on the right hand side which shows structures where material is compressed due to converging velocities in red. As one can see, during infall the gas forms less but more condensed structures the closer it gets to the central sink particle.
Current usage metrics show cumulative count of Article Views (full-text article views including HTML views, PDF and ePub downloads, according to the available data) and Abstracts Views on Vision4Press platform.
Data correspond to usage on the plateform after 2015. The current usage metrics is available 48-96 hours after online publication and is updated daily on week days.
Initial download of the metrics may take a while.