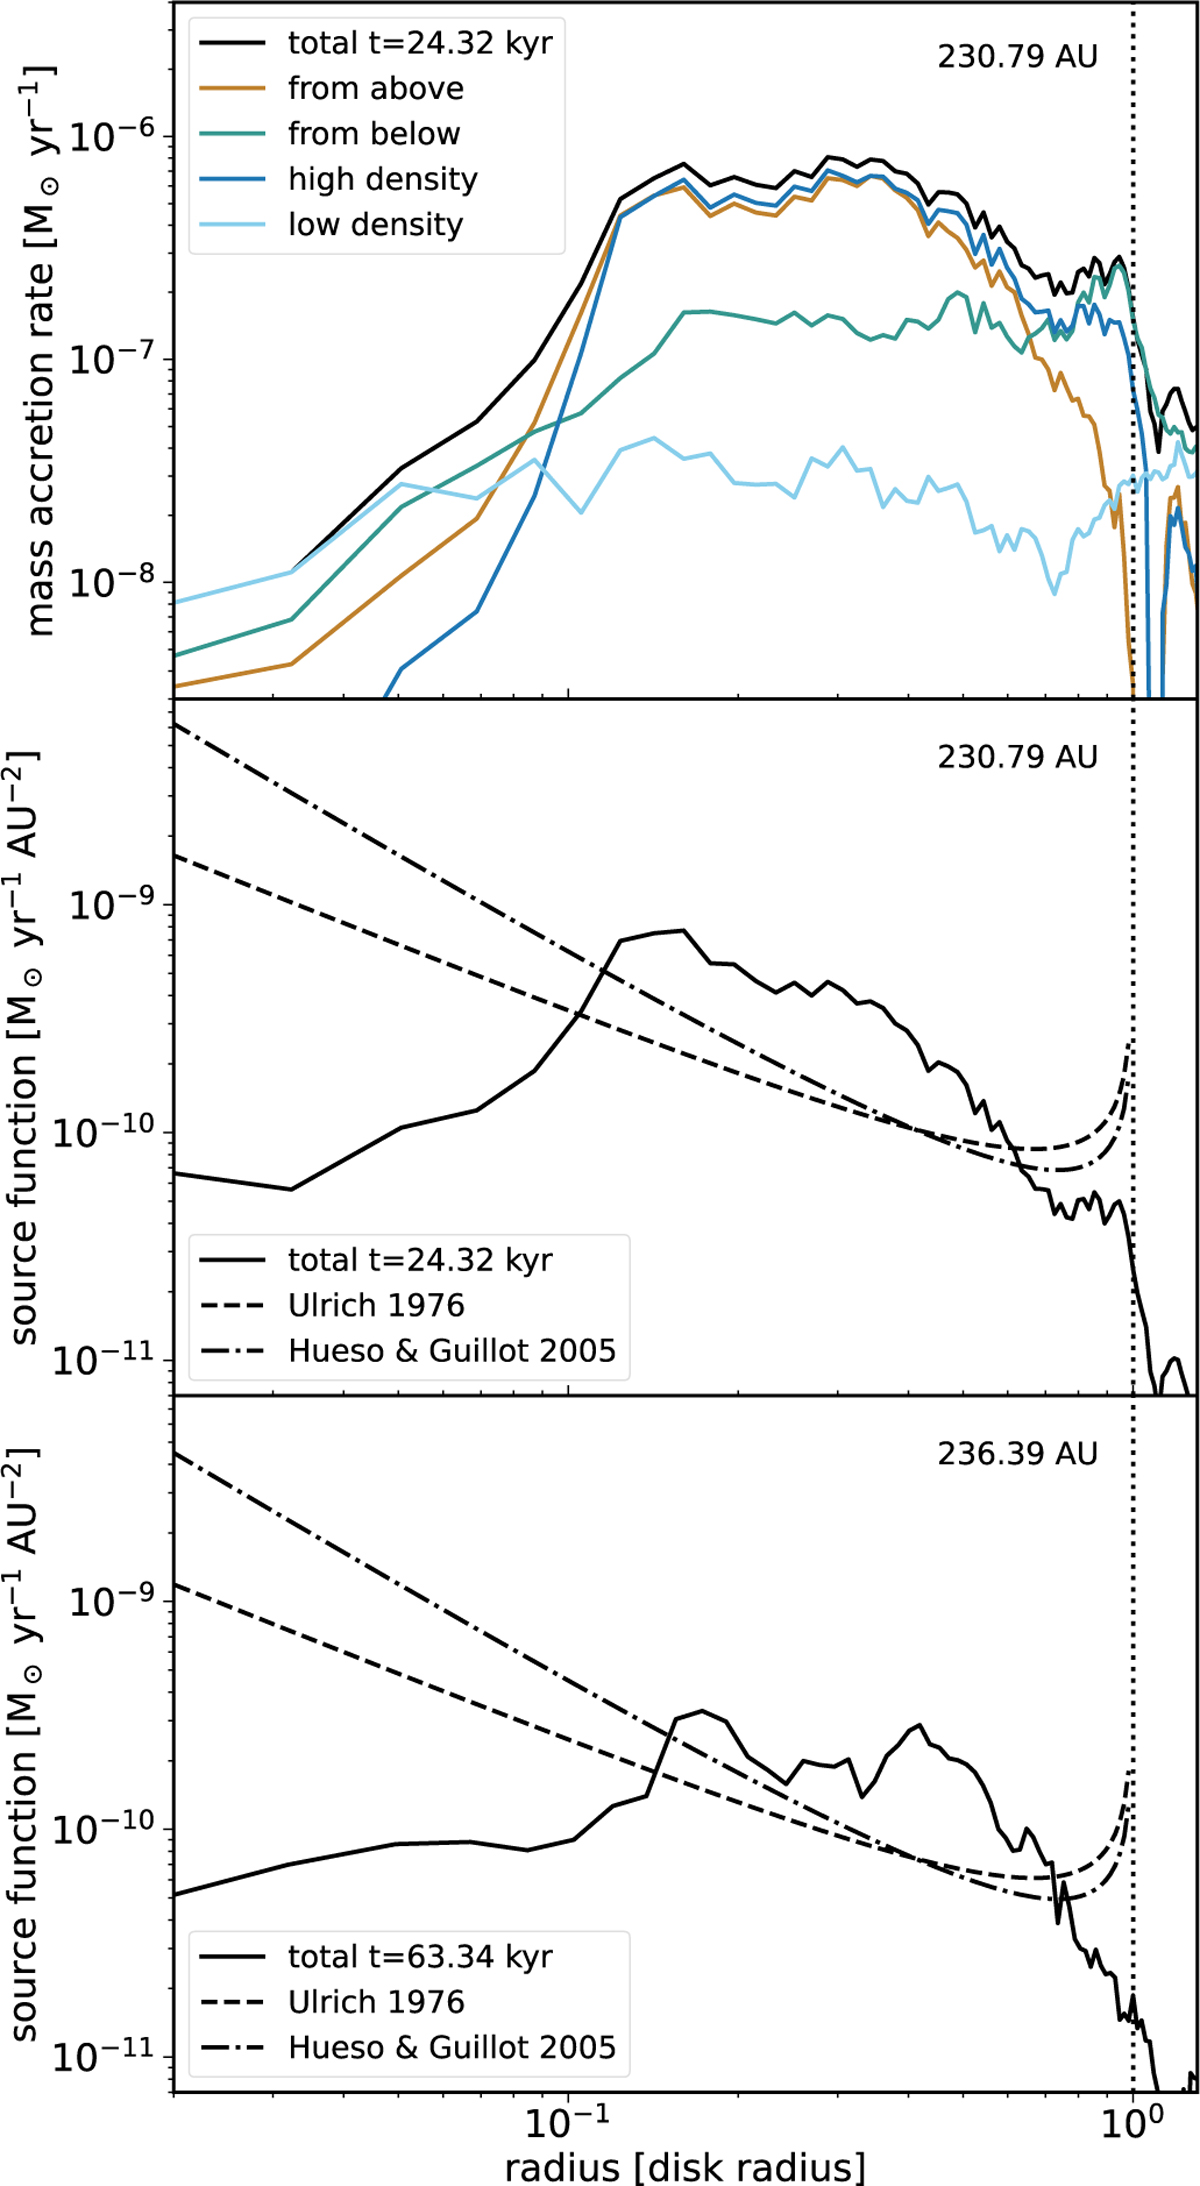
Fig. 11
Download original image
Mass accretion onto the disk measured at ten cells above and below the central plane. The x-axis is normalised by the disk radius as indicated by the vertical dotted line. The top panel shows the total mass accretion rate given by the black line. In addition, the red and teal line split the total rate into the side of the disk the material is accreted onto. Moreover, the light and dark blue lines divide the total rate into low and high density material by setting a density threshold. The middle panel shows the source function, that is the mass accretion rate normalised by its azimuthal surface area, together with its analytic predictions for solid body rotation. In comparison, the bottom panel shows the same as the middle panel but for a snapshot at a late time step in the protostellar disk accretion.
Current usage metrics show cumulative count of Article Views (full-text article views including HTML views, PDF and ePub downloads, according to the available data) and Abstracts Views on Vision4Press platform.
Data correspond to usage on the plateform after 2015. The current usage metrics is available 48-96 hours after online publication and is updated daily on week days.
Initial download of the metrics may take a while.