Fig. 10
Download original image
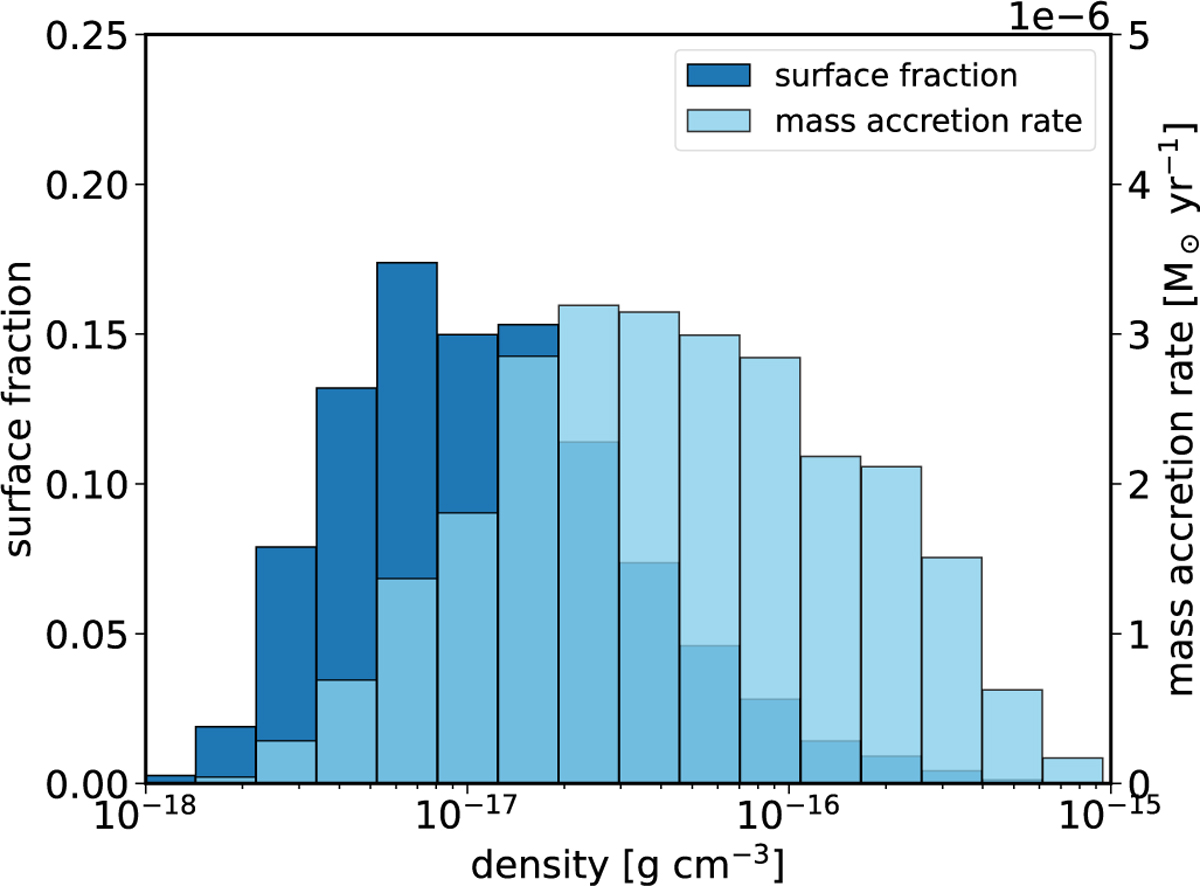
Mass accretion distribution as function of density at a distance of 400 AU from the central sink particle. The dark blue bars show the distribution of the surface fraction of each density bin and the light blue bars show their respective total accretion rate. As one can see, most mass is accreted at high densities and low surface fractions.
Current usage metrics show cumulative count of Article Views (full-text article views including HTML views, PDF and ePub downloads, according to the available data) and Abstracts Views on Vision4Press platform.
Data correspond to usage on the plateform after 2015. The current usage metrics is available 48-96 hours after online publication and is updated daily on week days.
Initial download of the metrics may take a while.