Open Access
Fig. 6.
Download original image
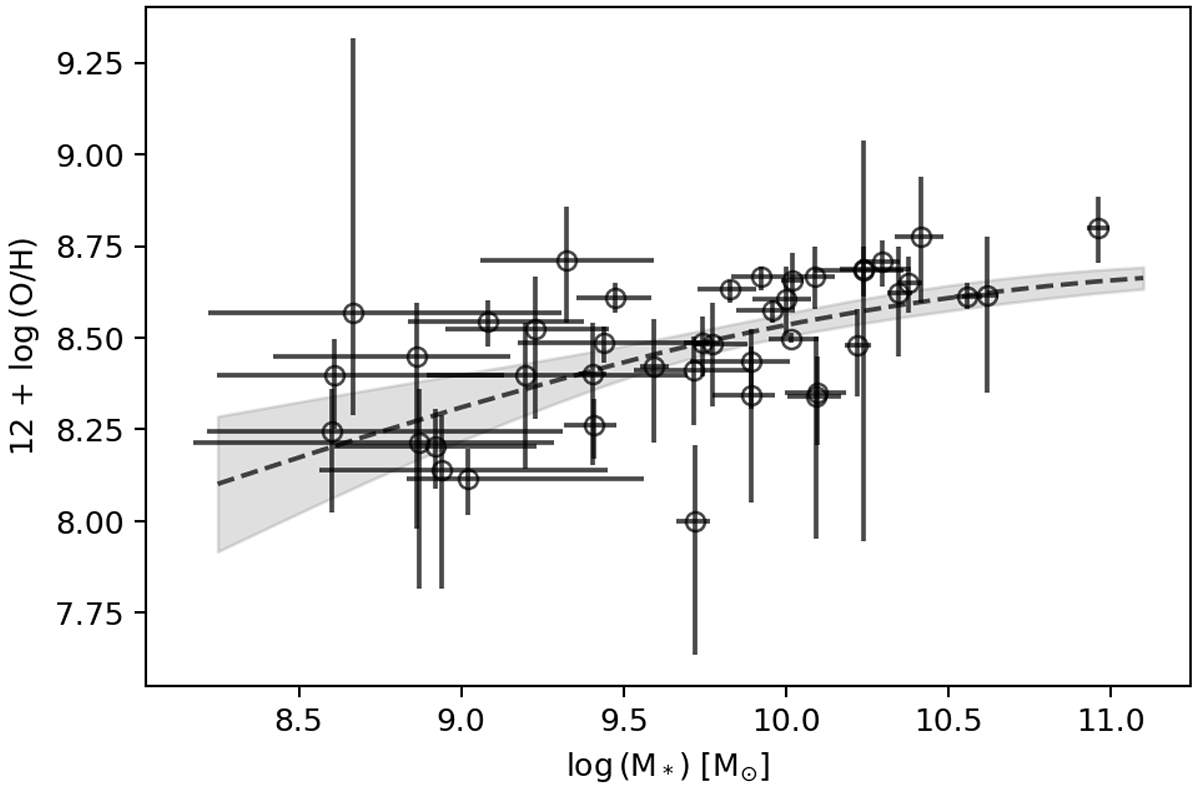
MZR for the SFGs of Cl0024. Our data are the open circles, the black-dashed line represents the mean of the fitted values employing the recipe by Curti et al. (2020), and the grey area represents the 1σ deviation of the fits.
Current usage metrics show cumulative count of Article Views (full-text article views including HTML views, PDF and ePub downloads, according to the available data) and Abstracts Views on Vision4Press platform.
Data correspond to usage on the plateform after 2015. The current usage metrics is available 48-96 hours after online publication and is updated daily on week days.
Initial download of the metrics may take a while.