Open Access
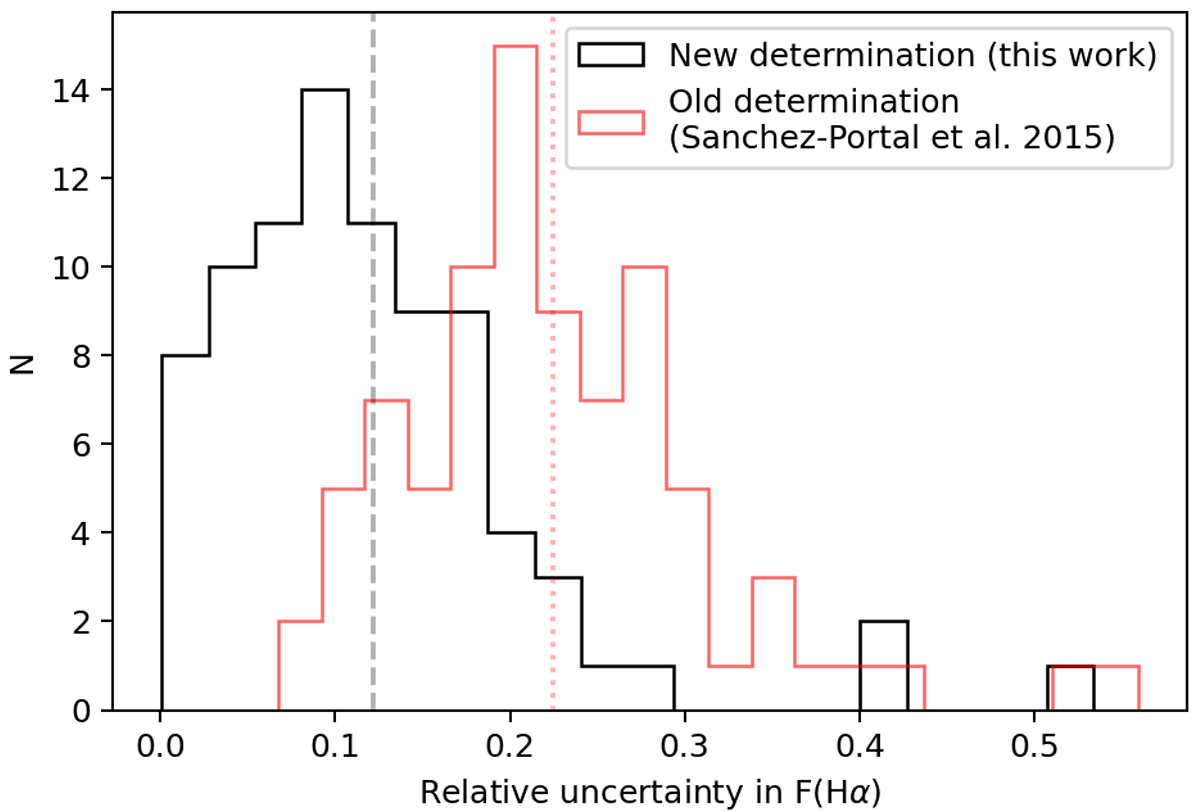
Fig. 4.
Download original image
Histogram of the relative uncertainty in the flux determination in the Hα line. The red histogram is the error from Sánchez-Portal et al. (2015). The red dotted line is the median value of the relative error. The black histogram is the relative error from this work. The grey dashed line represents the median value.
Current usage metrics show cumulative count of Article Views (full-text article views including HTML views, PDF and ePub downloads, according to the available data) and Abstracts Views on Vision4Press platform.
Data correspond to usage on the plateform after 2015. The current usage metrics is available 48-96 hours after online publication and is updated daily on week days.
Initial download of the metrics may take a while.