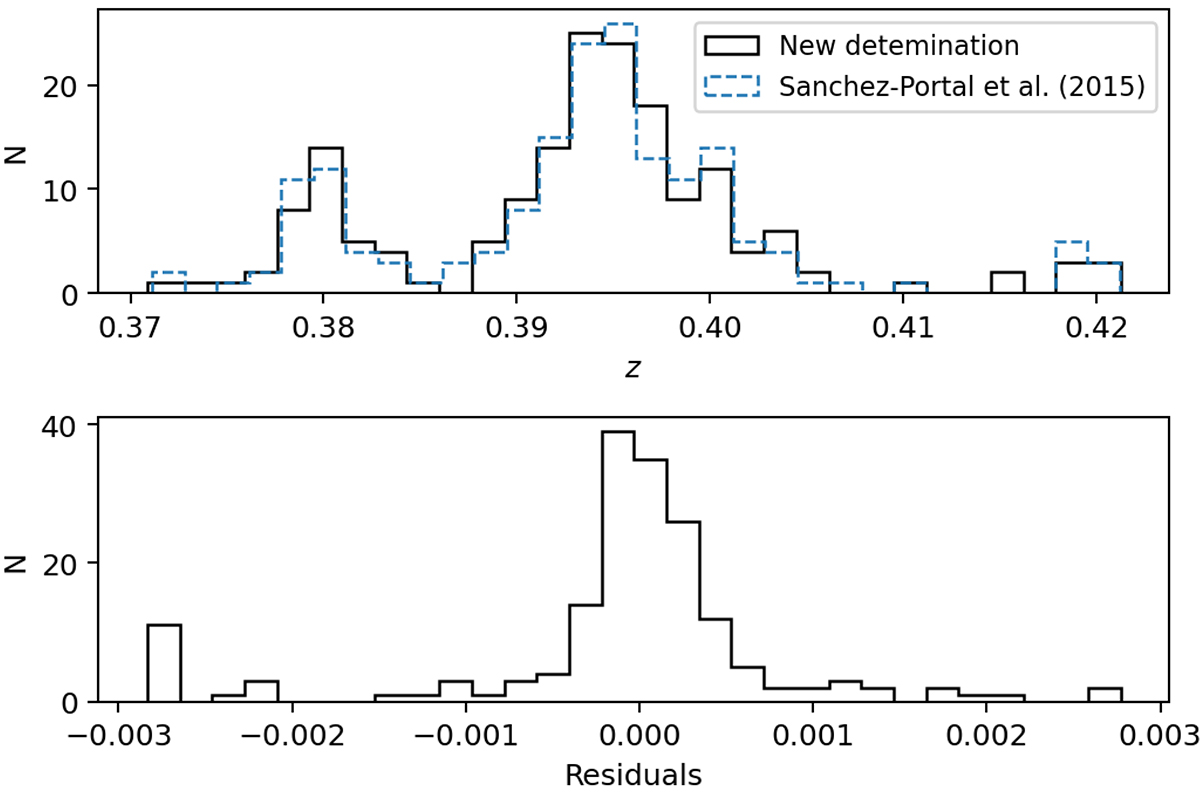
Fig. 2.
Download original image
Redshift distribution for the galaxies presented in this study of Cl0024. The upper panel shows the distribution of redshifts derived from the new determination (solid line) and the determination from Sánchez-Portal et al. (2015) (dashed line). The lower panel shows the distribution of the residuals between the old and the new redshift determination. This figure includes all the galaxies (tiers 1 to 3, and “no deblending” and “composite Hα, lines”).
Current usage metrics show cumulative count of Article Views (full-text article views including HTML views, PDF and ePub downloads, according to the available data) and Abstracts Views on Vision4Press platform.
Data correspond to usage on the plateform after 2015. The current usage metrics is available 48-96 hours after online publication and is updated daily on week days.
Initial download of the metrics may take a while.