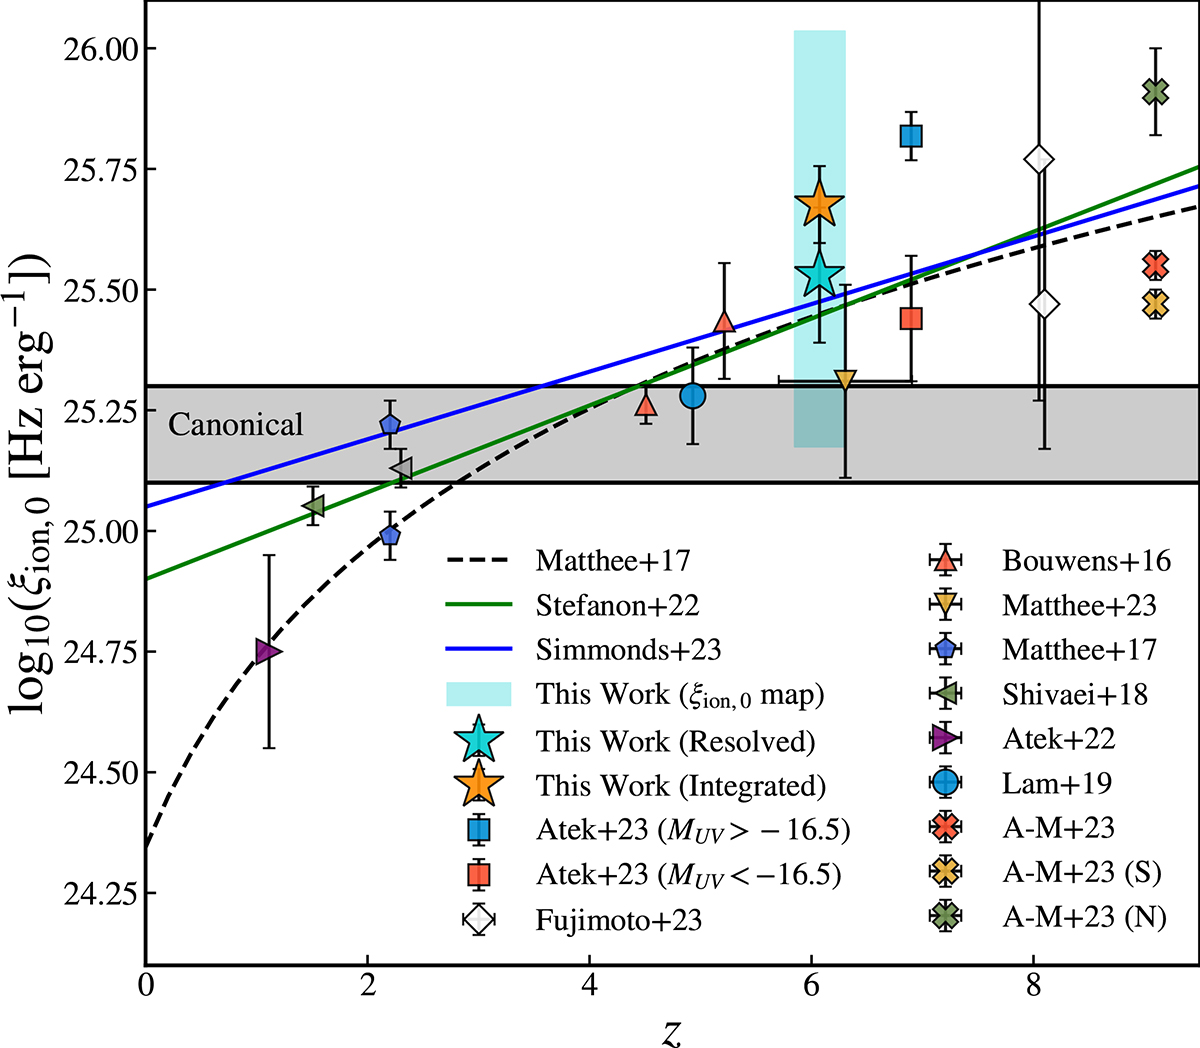
Fig. 8.
Download original image
Evolution of the ionising photon production with redshift. The stars correspond to this work, with the orange and turquoise representing the integrated and resolved ξion, 0 estimates, respectively. The turquoise shaded region shows the range of values of the 2D ξion, 0 map displayed in Fig. 7. The grey shaded region indicates the canonical values (Robertson et al. 2013). The rest of literature values are from Bouwens et al. (2016), Matthee et al. (2017, 2023), Shivaei et al. (2018), Lam et al. (2019), Atek et al. (2022, 2024), Fujimoto et al. (2023), Álvarez-Márquez et al. (2024) (A-M+23), as well as the trends from Matthee et al. (2017), Stefanon et al. (2022), and Simmonds et al. (2024).
Current usage metrics show cumulative count of Article Views (full-text article views including HTML views, PDF and ePub downloads, according to the available data) and Abstracts Views on Vision4Press platform.
Data correspond to usage on the plateform after 2015. The current usage metrics is available 48-96 hours after online publication and is updated daily on week days.
Initial download of the metrics may take a while.