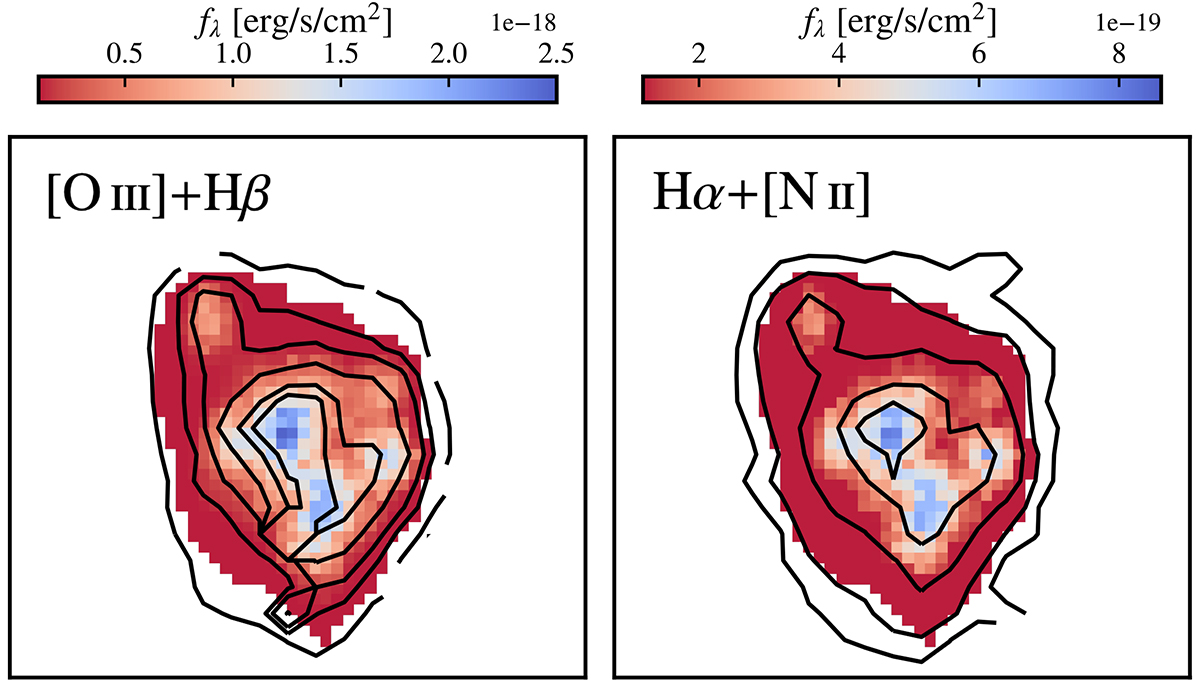
Fig. 3.
Download original image
Maps of the emission line fluxes obtained with the pixel-by-pixel SED fitting on the NIRCam images with a constant SFH. The contours correspond to the observed spectrum with the NIRSpec IFU (Fujimoto et al., in prep.). The maps are centred at (α, δ) = (06:00:09.55, −20:08:11.26) and 2 arcsec per side. Left: map and contours for the [O III]+Hβ emission. The IFU contour levels are 0.1, 0.2, 0.3, 0.5, 0.8, and 1 × 10⁻¹⁷ erg s−1 cm−2. Right: map and contours for the Hα+[N II] emission. The contour levels correspond to 0.3, 0.5, 1, 2, and 3 × 10⁻¹⁸ erg s−1 cm−2.
Current usage metrics show cumulative count of Article Views (full-text article views including HTML views, PDF and ePub downloads, according to the available data) and Abstracts Views on Vision4Press platform.
Data correspond to usage on the plateform after 2015. The current usage metrics is available 48-96 hours after online publication and is updated daily on week days.
Initial download of the metrics may take a while.