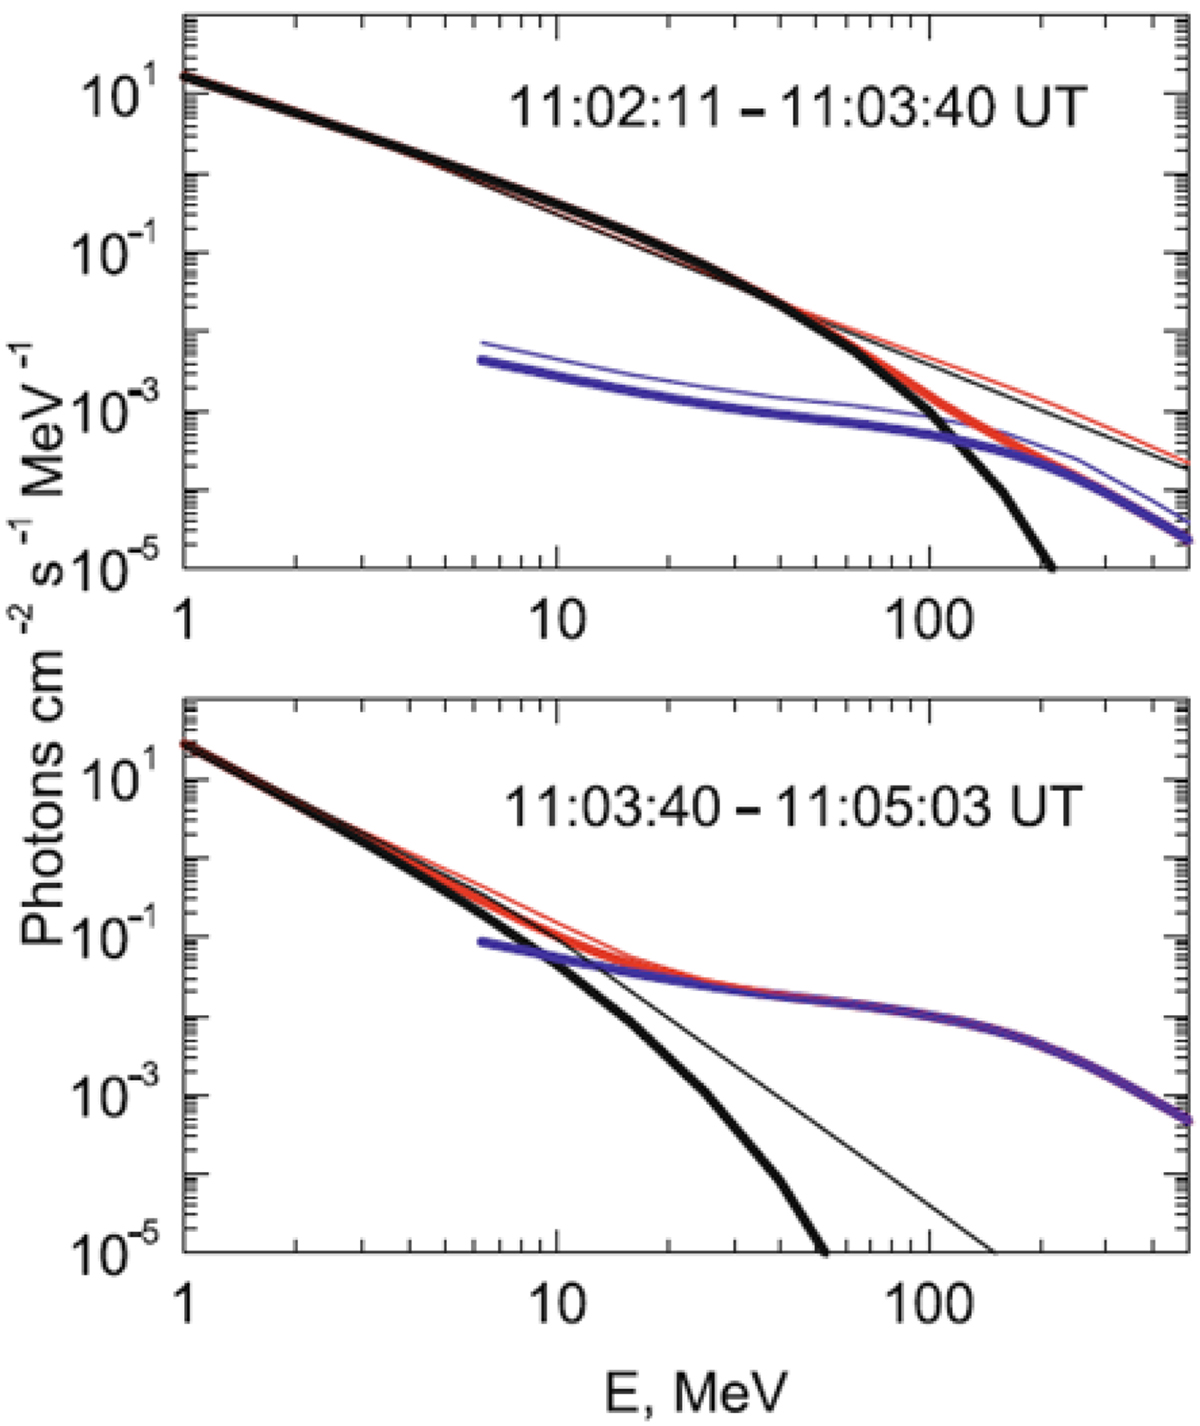
Fig. 9.
Download original image
Gamma-ray emission spectra observed by CORONAS/SONG; from Fig. 8 of Kuznetsov et al. (2011), reproduced under Springer Nature License Number # 5605391357254. Upper panel: spectrum accumulated over the main rise phase. Bottom panel: spectrum accumulated over the most part of the main energy release phase. The red curves represent the total spectra and the black curves indicate the continuum component (thin curves correspond to a power law with varying index and the thick curves correspond to a power law with an exponential cutoff), while the blue curves show the π-decay component.
Current usage metrics show cumulative count of Article Views (full-text article views including HTML views, PDF and ePub downloads, according to the available data) and Abstracts Views on Vision4Press platform.
Data correspond to usage on the plateform after 2015. The current usage metrics is available 48-96 hours after online publication and is updated daily on week days.
Initial download of the metrics may take a while.