Fig. 8.
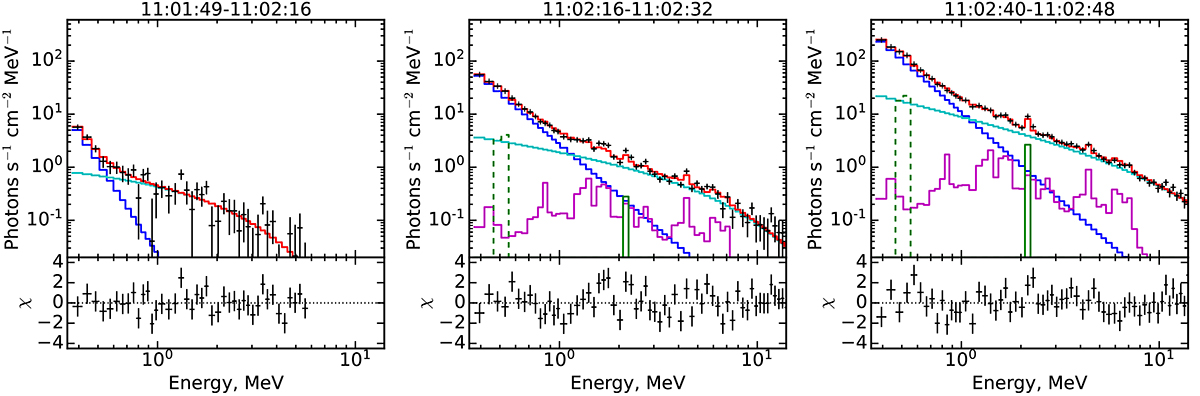
Download original image
Konus-Wind spectra accumulated over three time intervals during the main rise phase: 11:01:49–11:02:16 (left), 11:02:16–11:02:32 (middle), 11:02:40–11:02:48 (right). Black crosses represent the photon spectrum, color curves indicate model components: PL (blue), CPL (cian), nuclear deexcitation lines (magenta), neutron capture line (green), electron-positron annihilation line (dashed green), and the sum of all components (red). The bottom panels on each plot represent the fit residuals.
Current usage metrics show cumulative count of Article Views (full-text article views including HTML views, PDF and ePub downloads, according to the available data) and Abstracts Views on Vision4Press platform.
Data correspond to usage on the plateform after 2015. The current usage metrics is available 48-96 hours after online publication and is updated daily on week days.
Initial download of the metrics may take a while.