Fig. 4.
Download original image
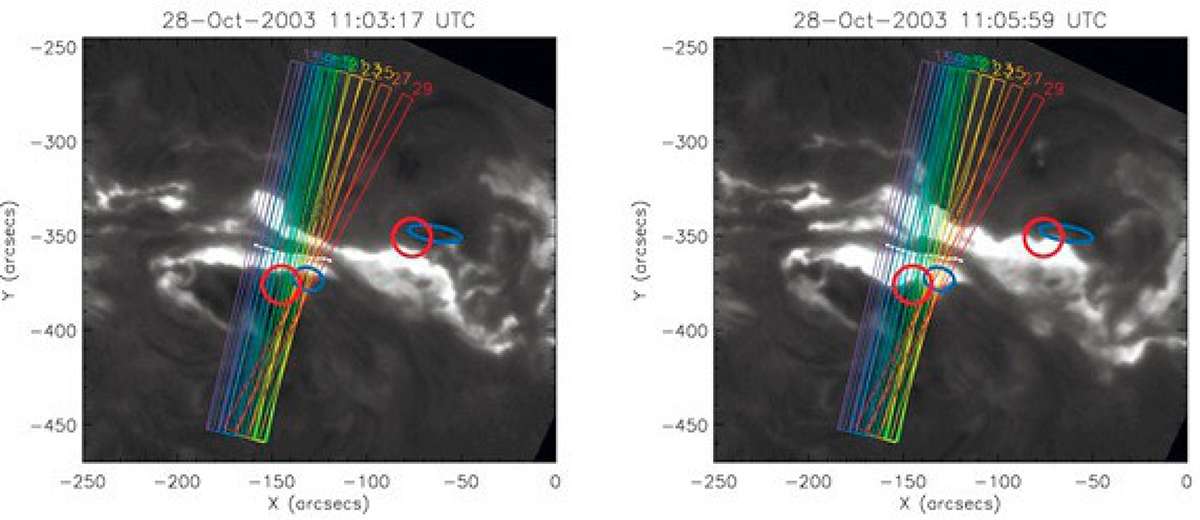
Hα images observed at the main rise phase (left) and at the main energy release phase peak (right). The local PIL segment is shown by the white line. Multicolor rectangles indicate the directions perpendicular to the local PIL segments, along which we followed the flare ribbon separation to derive the local electric field strength evolution Ec(r, t). Overlaid on the Hα image is the RHESSI HXR 100−200 keV (blue) and the 2.2 MeV γ-ray line (red) contours for 11:06:20–11:09:20 UT (from Hurford et al. 2006). The two HXR FPs lie on the outer borders of the extended conjugated Hα ribbons. We note that one of the two footpoints (rooted in negative polarity) is located outside the 30 positions along the PIL that we are studying.
Current usage metrics show cumulative count of Article Views (full-text article views including HTML views, PDF and ePub downloads, according to the available data) and Abstracts Views on Vision4Press platform.
Data correspond to usage on the plateform after 2015. The current usage metrics is available 48-96 hours after online publication and is updated daily on week days.
Initial download of the metrics may take a while.