Fig. 2.
Download original image
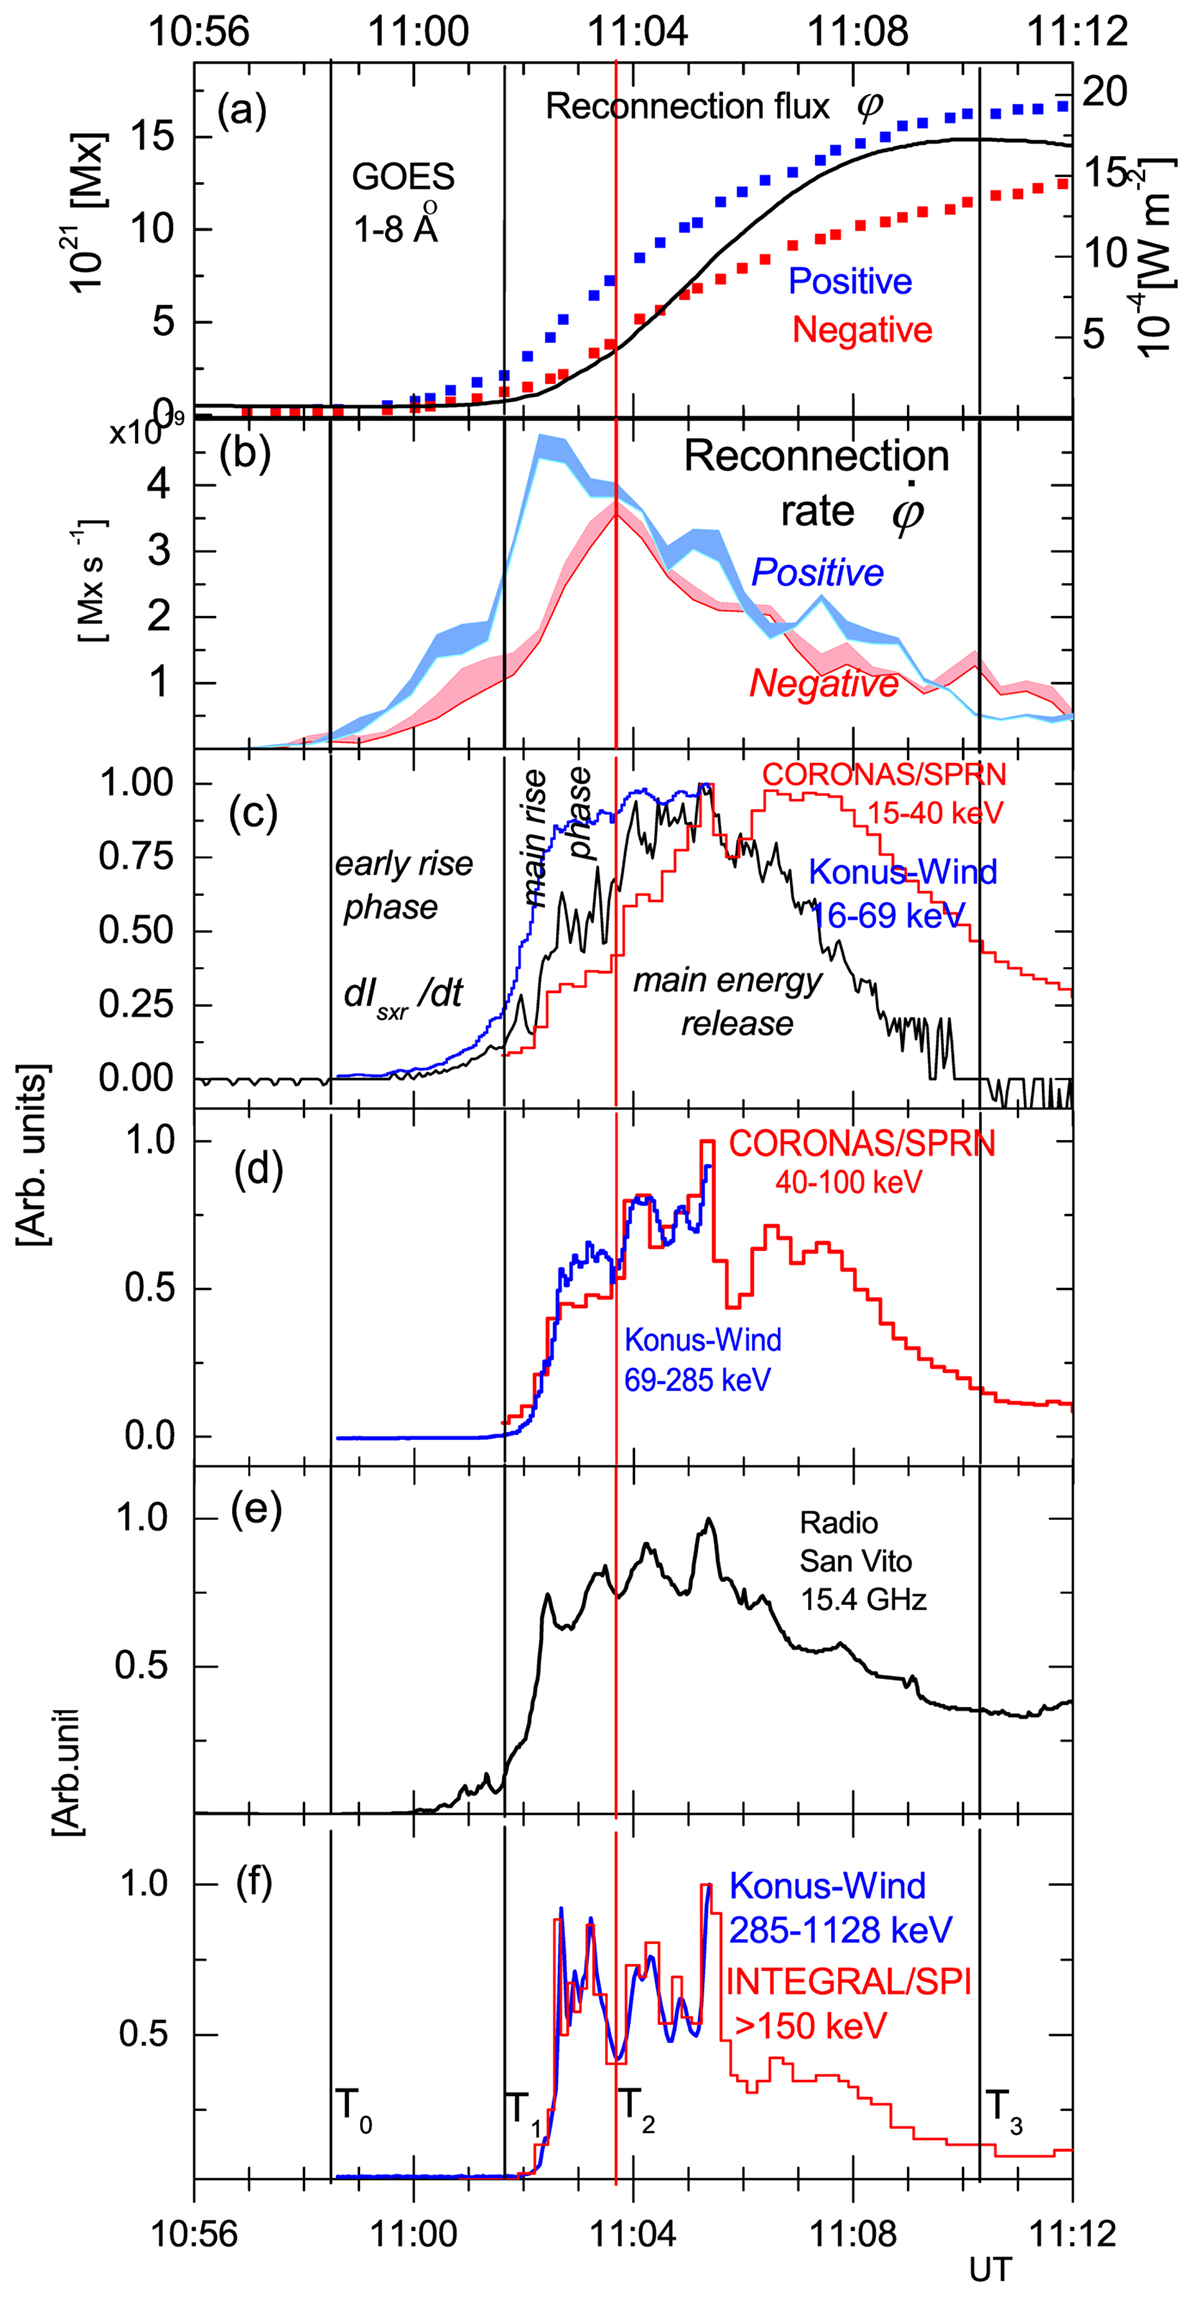
Observables of the 2003 October 28 flare. (a) Reconnection flux derived in the positive (blue) and negative (red) domains (left Y-axis) and the GOES 1−8 Å soft X-ray flux ISXR(t) (black curve, right Y-axis). (b) Reconnection rates ![]() positive (blue) and negative (red). (c) dISXR/dt (black), Konus-Wind count rate at 16−69 keV (blue) and CORONAS-F/SPRN rate at 15−40 keV (red). (d) Konus-Wind rate at 69−285 keV (blue) and CORONAS-F/SPRN rate at 40−100 keV (red). (e) 15.4 GHz microwave emission flux (black). (f) INTEGRAL/SPI flux above 150 keV (from Kiener et al. 2006, red) and Konus-Wind rate at 285−1128 keV (blue). The early rise phase onset time T0 = 10:58:30 UT and the main rise phase onset time T1 = 11:01:16 UT are marked with black vertical lines. The red vertical line indicates the onset of the main energy release phase, T2 = 11:03:40 UT, that ended at about T3 = 11:10 UT.
positive (blue) and negative (red). (c) dISXR/dt (black), Konus-Wind count rate at 16−69 keV (blue) and CORONAS-F/SPRN rate at 15−40 keV (red). (d) Konus-Wind rate at 69−285 keV (blue) and CORONAS-F/SPRN rate at 40−100 keV (red). (e) 15.4 GHz microwave emission flux (black). (f) INTEGRAL/SPI flux above 150 keV (from Kiener et al. 2006, red) and Konus-Wind rate at 285−1128 keV (blue). The early rise phase onset time T0 = 10:58:30 UT and the main rise phase onset time T1 = 11:01:16 UT are marked with black vertical lines. The red vertical line indicates the onset of the main energy release phase, T2 = 11:03:40 UT, that ended at about T3 = 11:10 UT.
Current usage metrics show cumulative count of Article Views (full-text article views including HTML views, PDF and ePub downloads, according to the available data) and Abstracts Views on Vision4Press platform.
Data correspond to usage on the plateform after 2015. The current usage metrics is available 48-96 hours after online publication and is updated daily on week days.
Initial download of the metrics may take a while.