Fig. 10.

Download original image
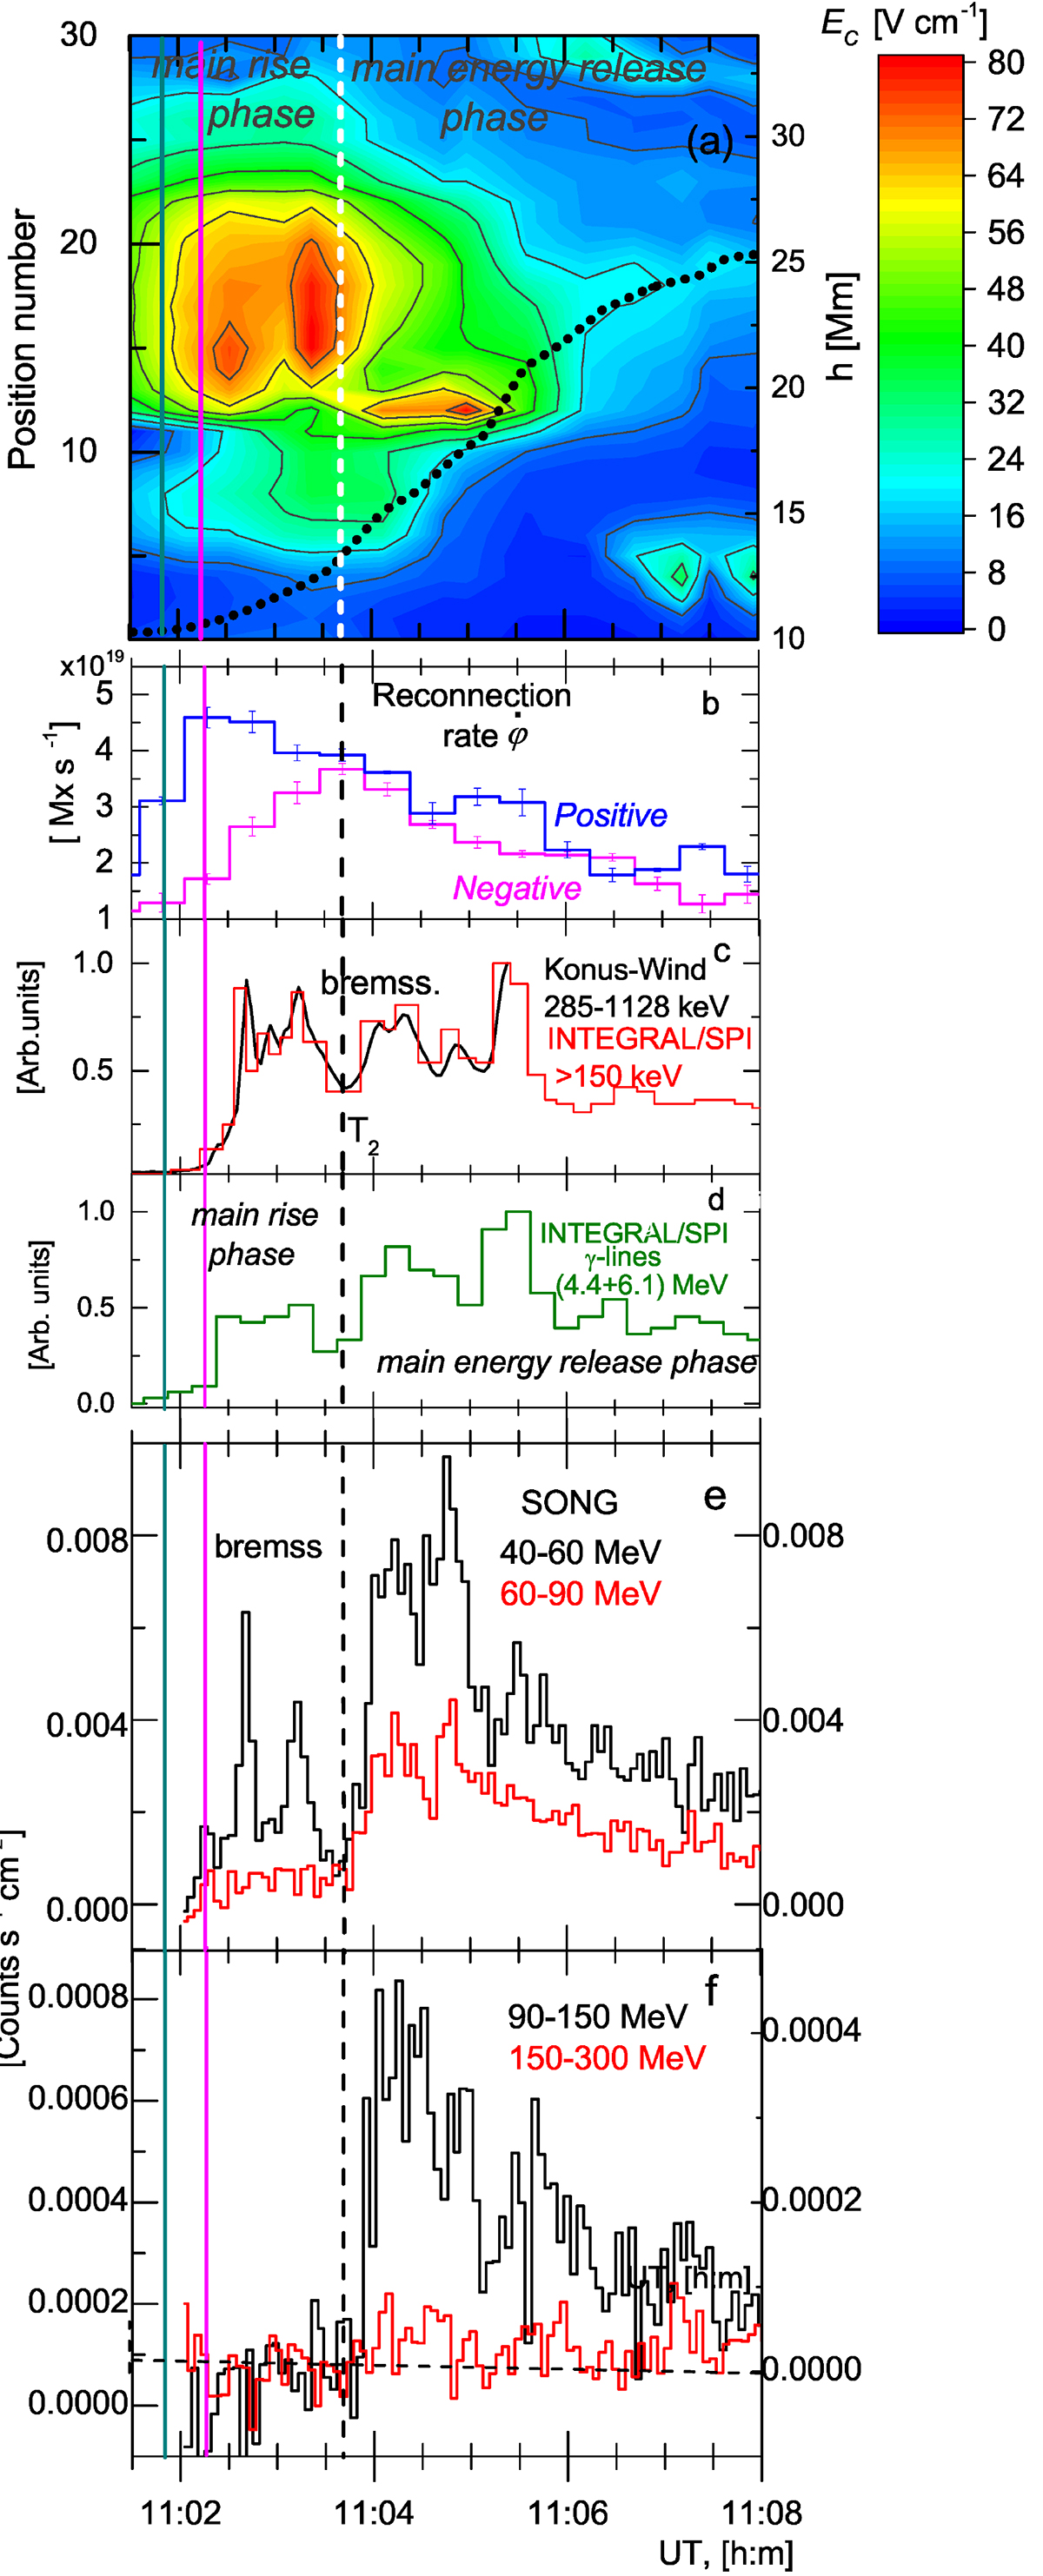
Local and global reconnection rates collated with high-energy electron and proton emissions during the main rise phase and the main energy release phase of the 2003 October 28 flare. (a) Contour plot of the local reconnection rate Ec(t) in the negative polarity domain, overplotted with the derived height-time evolution of the X-point (black points, right axis). (b) Time profiles of the global reconnection rates ![]() , separately for the two polarities. (c) Electron bremsstrahlung at intermediate energies observed by Konus-Wind (black) and INTEGRAL/SPI (red); from Kiener et al. (2006). (d) Prompt γ-ray lines from INTEGRAL data (Kiener et al. 2006). (e) and (f) Electron high-energy bremsstrahlung and π-decay emission observed by CORONAS/SONG; reproduced under Springer Nature License Number # 5605391357254 (see also Fig. 3). The dark-cyan thick line indicates the onset of the bremsstrahlung emissions with energies > 1 MeV at 11:01:49 UT. The magenta thick line indicates the onset of the γ-ray lines at 11:02:15 UT. The black dashed line indicates the onset of the main energy release phase at T2 = 11:03:40 UT.
, separately for the two polarities. (c) Electron bremsstrahlung at intermediate energies observed by Konus-Wind (black) and INTEGRAL/SPI (red); from Kiener et al. (2006). (d) Prompt γ-ray lines from INTEGRAL data (Kiener et al. 2006). (e) and (f) Electron high-energy bremsstrahlung and π-decay emission observed by CORONAS/SONG; reproduced under Springer Nature License Number # 5605391357254 (see also Fig. 3). The dark-cyan thick line indicates the onset of the bremsstrahlung emissions with energies > 1 MeV at 11:01:49 UT. The magenta thick line indicates the onset of the γ-ray lines at 11:02:15 UT. The black dashed line indicates the onset of the main energy release phase at T2 = 11:03:40 UT.
Current usage metrics show cumulative count of Article Views (full-text article views including HTML views, PDF and ePub downloads, according to the available data) and Abstracts Views on Vision4Press platform.
Data correspond to usage on the plateform after 2015. The current usage metrics is available 48-96 hours after online publication and is updated daily on week days.
Initial download of the metrics may take a while.


