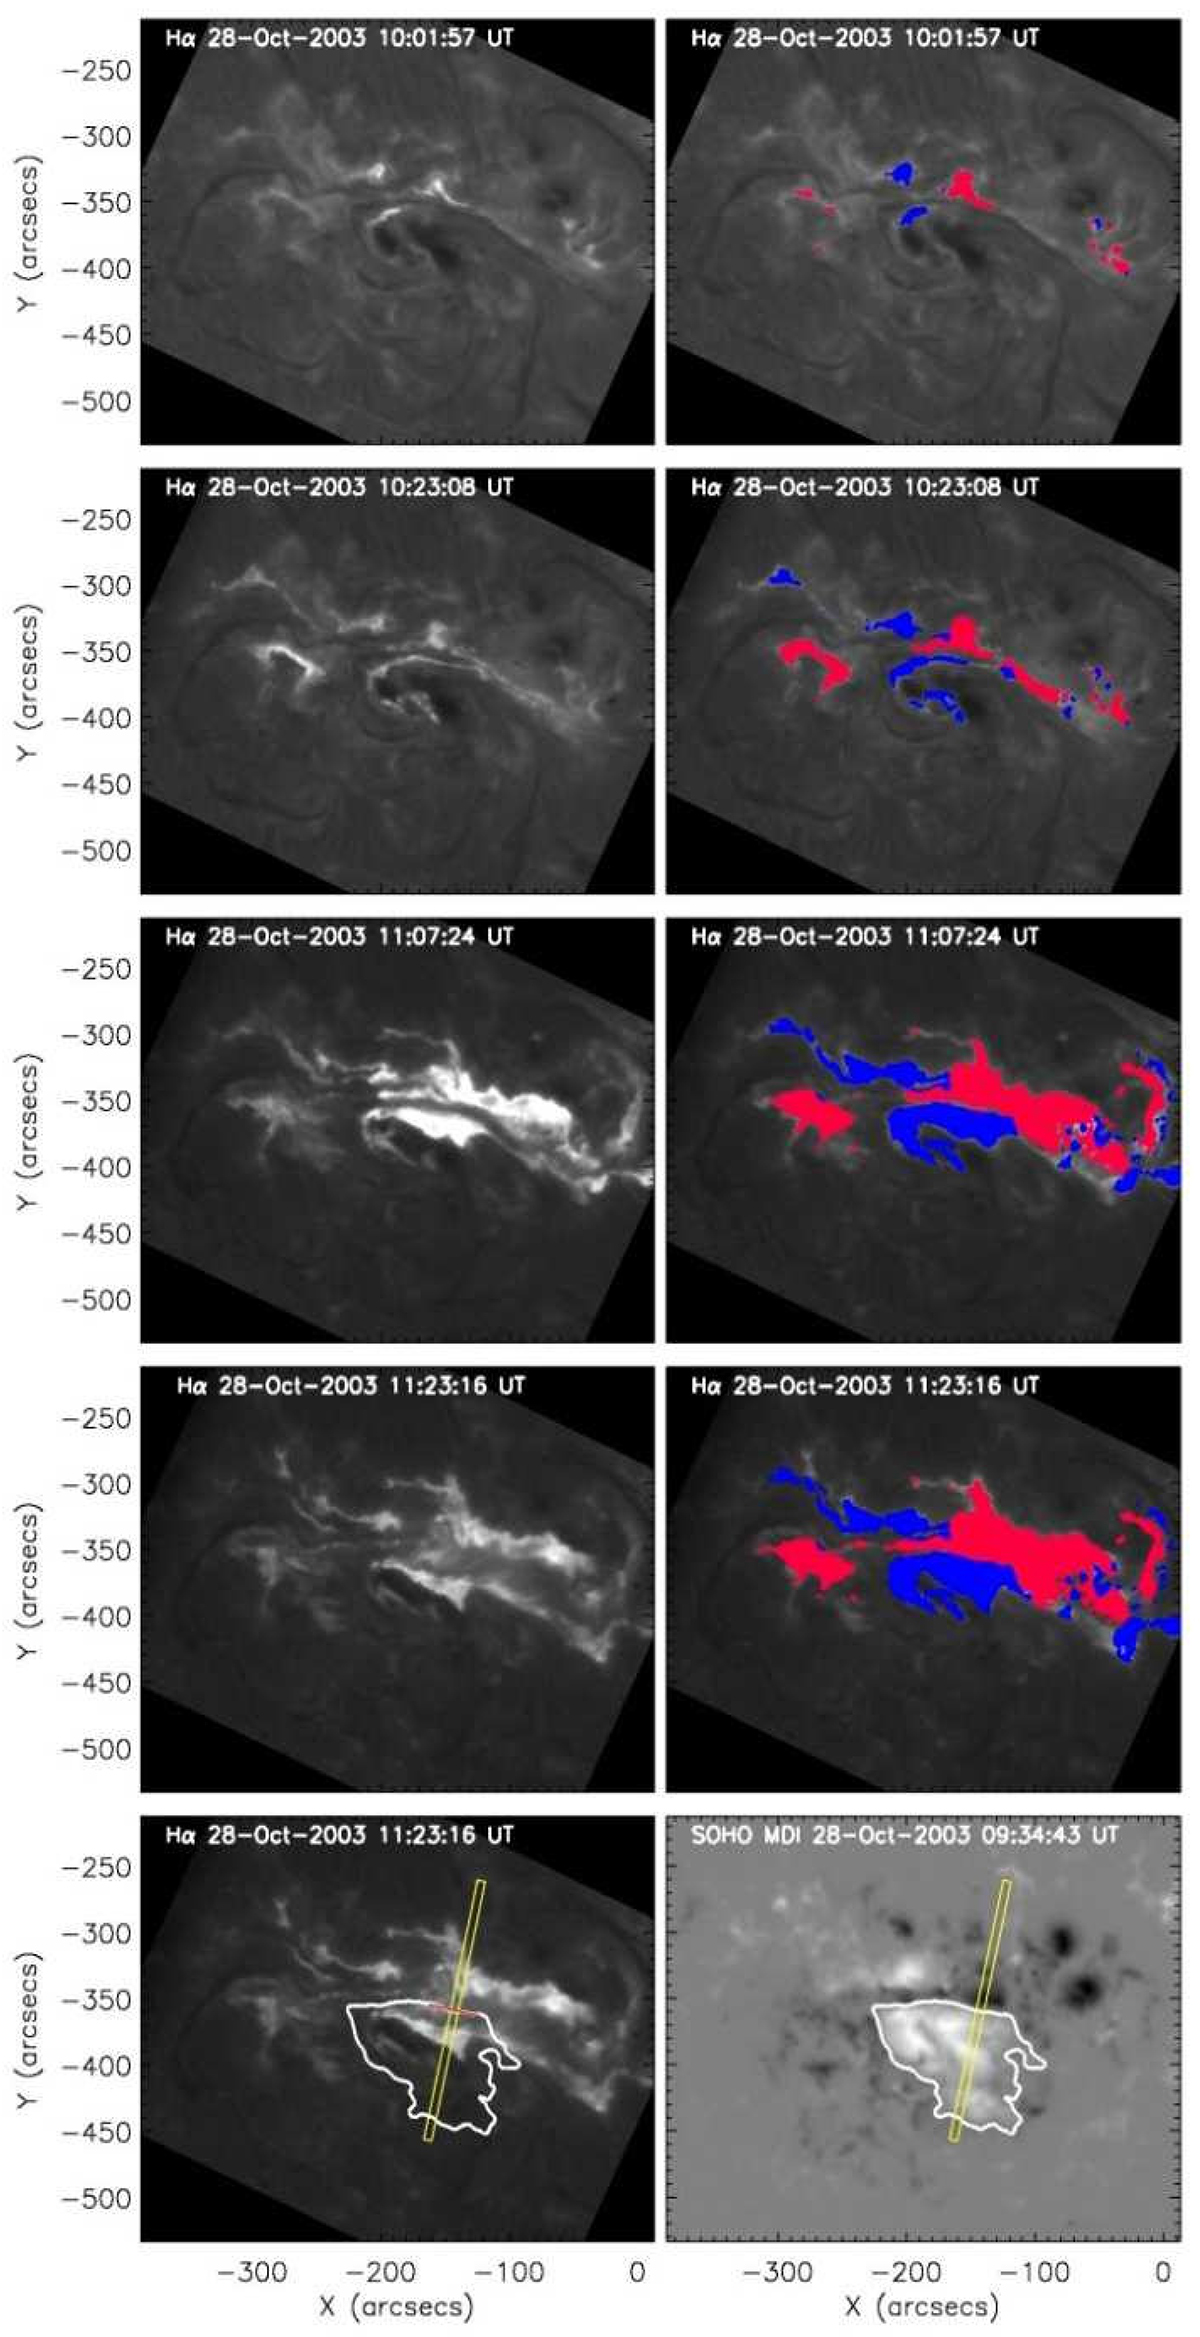
Fig. 1.
Download original image
Evolution of the 2003 October 28 flare observed by the USO Hα telescope for four different time steps covering the start, maximum, and decay phase of the flare (left panels). In the right panels, the total flare ribbon areas detected up to the respective recording time of the image are overplotted, separately in blue (red) for the positive (negative) magnetic polarities. In the bottom panels, we outline the flare PIL (white contour) derived from the corresponding pre-flare MDI LOS magnetic map shown in the right bottom panel. The narrow yellow rectangle in the bottom panels represents an example of one direction perpendicular to the local PIL segment (red line) along which the flare ribbons separation motion and Ec(r, t) were derived.
Current usage metrics show cumulative count of Article Views (full-text article views including HTML views, PDF and ePub downloads, according to the available data) and Abstracts Views on Vision4Press platform.
Data correspond to usage on the plateform after 2015. The current usage metrics is available 48-96 hours after online publication and is updated daily on week days.
Initial download of the metrics may take a while.