Open Access
Fig. 2.
Download original image
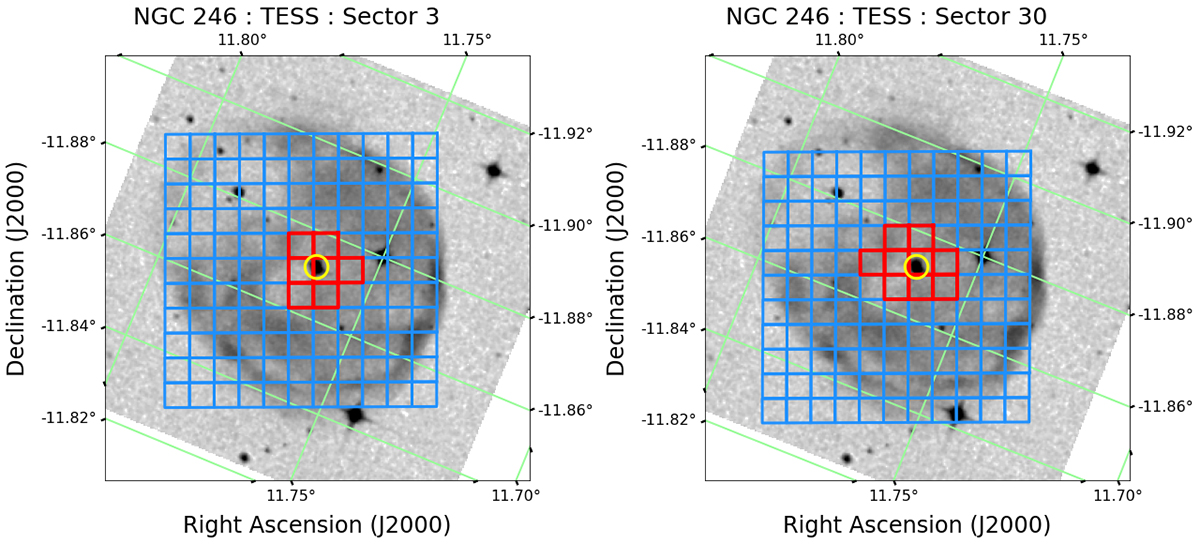
TESS Sectors 3 and 30 pipeline aperture overlaid on DSS2 Red sky image. The target is marked with yellow circles. The blue squares show the TPF overlay and the red squares show the TPF aperture overlay for each sector. The figure was produced using mkpy3 by Kenneth Mighell (https://github.com/KenMighell/mkpy3).
Current usage metrics show cumulative count of Article Views (full-text article views including HTML views, PDF and ePub downloads, according to the available data) and Abstracts Views on Vision4Press platform.
Data correspond to usage on the plateform after 2015. The current usage metrics is available 48-96 hours after online publication and is updated daily on week days.
Initial download of the metrics may take a while.