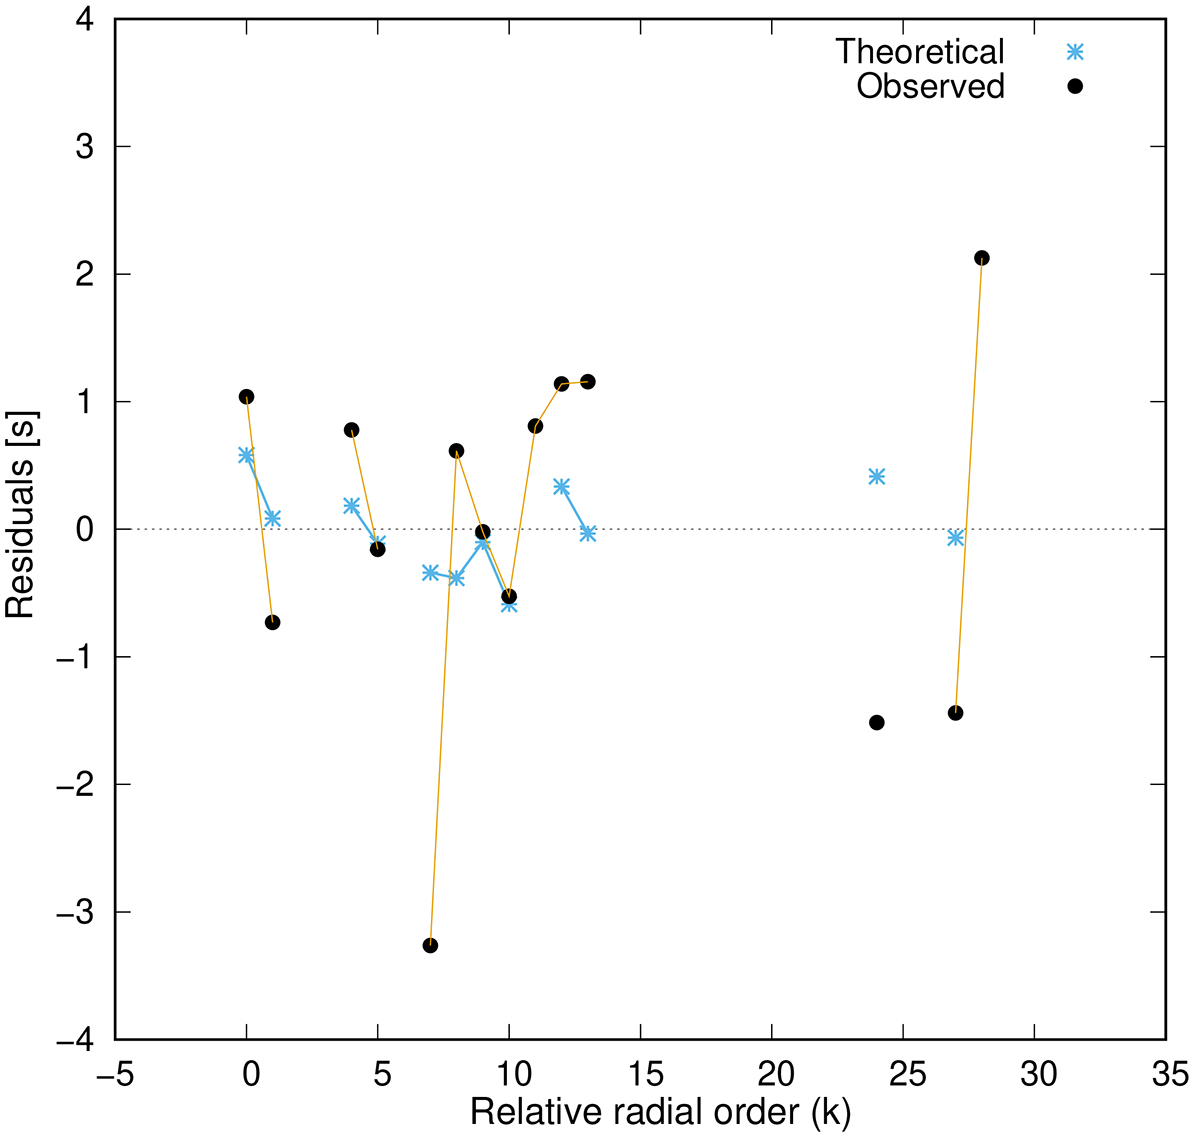
Fig. 11.
Download original image
Distribution of the residuals relative to the mean period spacing for the case of the observed periods (black points, see bottom panel of Fig. 6), along with the case for the theoretical periods (sky blue crosses) of the model fit with 0.565 M⊙ and ∼163 000 K, represented in terms of the relative radial order. As in Fig. 6, the thin lines connect modes with consecutive radial order.
Current usage metrics show cumulative count of Article Views (full-text article views including HTML views, PDF and ePub downloads, according to the available data) and Abstracts Views on Vision4Press platform.
Data correspond to usage on the plateform after 2015. The current usage metrics is available 48-96 hours after online publication and is updated daily on week days.
Initial download of the metrics may take a while.