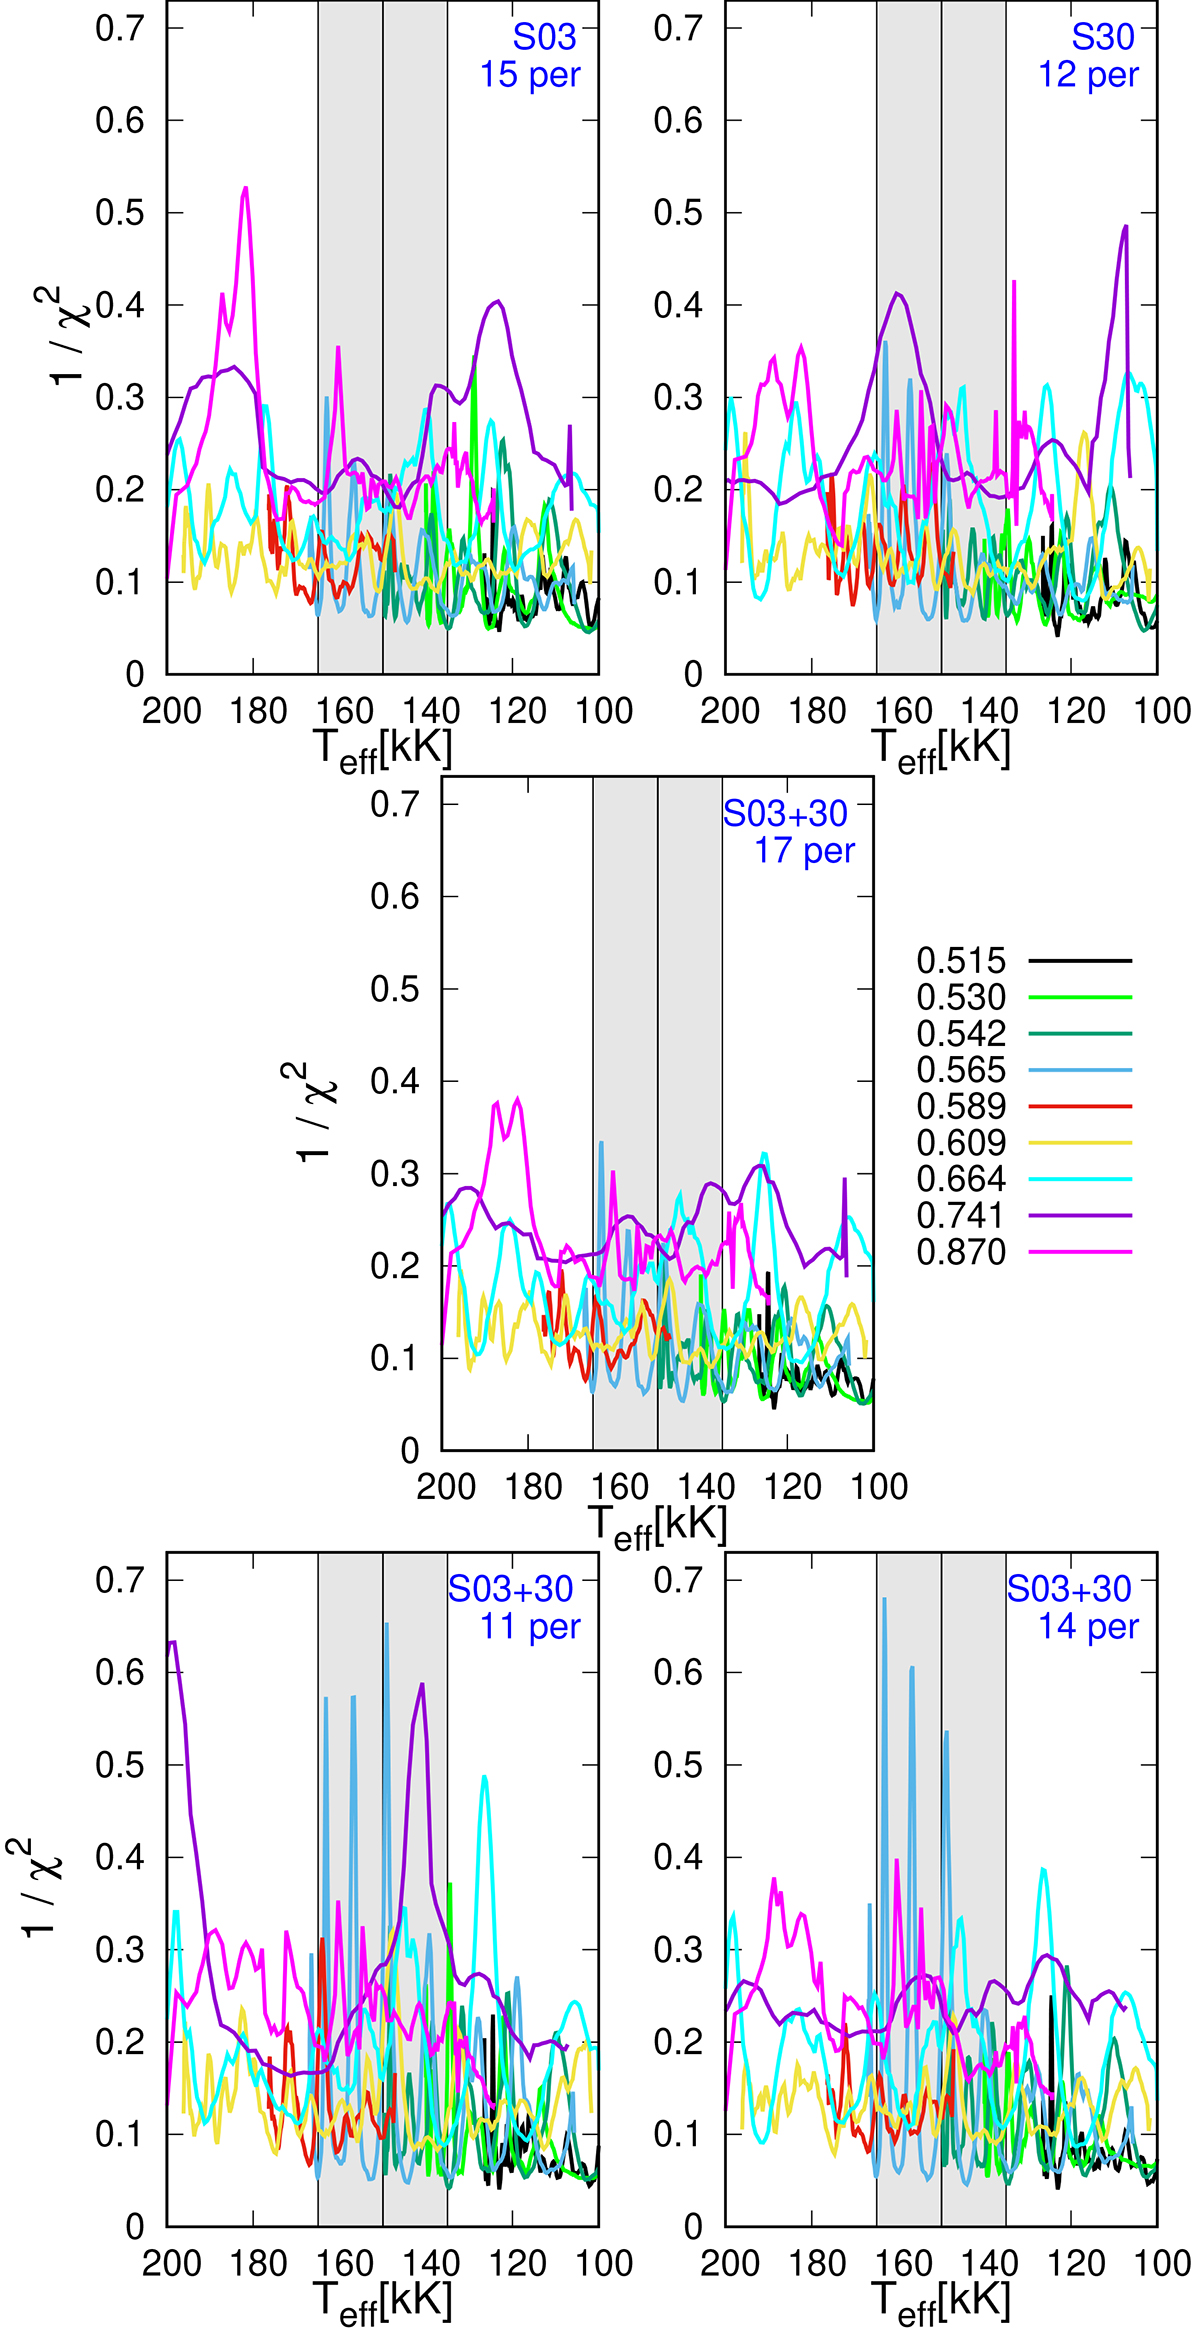
Fig. 10.
Download original image
Same as Fig. 9, but for the ℓ = 1, 2 case. The 1/χ2 values are much higher than for the ℓ = 1 case (Fig. 9), indicating that these models fit the data better. The middle panel demonstrates that there is not a particularly preferred model fit in the case of all 17 periods from the combined sectors. In the two bottom panels, the 0.565 M⊙ sequence has several models that fit the data well within the observed temperature bounds. In the 11-period case there is also a 0.74 M⊙ model that fits.
Current usage metrics show cumulative count of Article Views (full-text article views including HTML views, PDF and ePub downloads, according to the available data) and Abstracts Views on Vision4Press platform.
Data correspond to usage on the plateform after 2015. The current usage metrics is available 48-96 hours after online publication and is updated daily on week days.
Initial download of the metrics may take a while.