Fig. 6.

Download original image
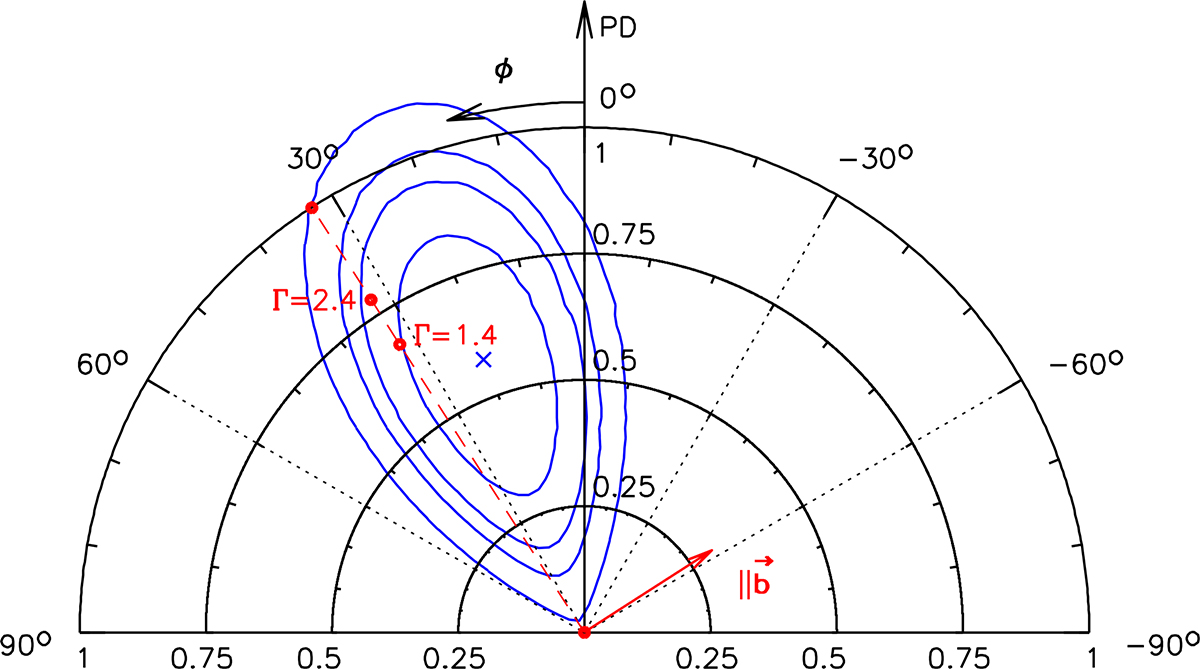
Confidence regions for polarization degree (PD) and polarization angle (PA; equatorial coordinate system) derived from the IXPE data, assuming that the polarized emission corresponds to the Wings-e spectral model. The blue line shows the contours of the χ2 statistic after subtraction of the minimum value ![]() reached at PD ≈ 0.57 and PA ≈ 21° (marked with a blue cross). The contours show Δχ2 = 2.3, 4.61, 6.17, and 9.21 levels, corresponding to 68.3% (1σ), 90%, 95.4% (2σ), and 99% confidence levels, respectively. The red dashed line illustrates the expected PA in the case, when the electric field vector is parallel to the Galactic plane, and two circles mark the maximum polarization for synchrotron emission for Γ = 1.4 and 2.4 (as labeled next to them). The outmost contour extends to PD values larger than 1. This is a plausible outcome of our procedure when the Q(E) and U(E) data are taken from IXPE, while I(E) is based on the Chandra data extracted from a smaller region, which is supposed to be polarized and might not coincide with true polarized I(E) seen by IXPE.
reached at PD ≈ 0.57 and PA ≈ 21° (marked with a blue cross). The contours show Δχ2 = 2.3, 4.61, 6.17, and 9.21 levels, corresponding to 68.3% (1σ), 90%, 95.4% (2σ), and 99% confidence levels, respectively. The red dashed line illustrates the expected PA in the case, when the electric field vector is parallel to the Galactic plane, and two circles mark the maximum polarization for synchrotron emission for Γ = 1.4 and 2.4 (as labeled next to them). The outmost contour extends to PD values larger than 1. This is a plausible outcome of our procedure when the Q(E) and U(E) data are taken from IXPE, while I(E) is based on the Chandra data extracted from a smaller region, which is supposed to be polarized and might not coincide with true polarized I(E) seen by IXPE.
Current usage metrics show cumulative count of Article Views (full-text article views including HTML views, PDF and ePub downloads, according to the available data) and Abstracts Views on Vision4Press platform.
Data correspond to usage on the plateform after 2015. The current usage metrics is available 48-96 hours after online publication and is updated daily on week days.
Initial download of the metrics may take a while.


