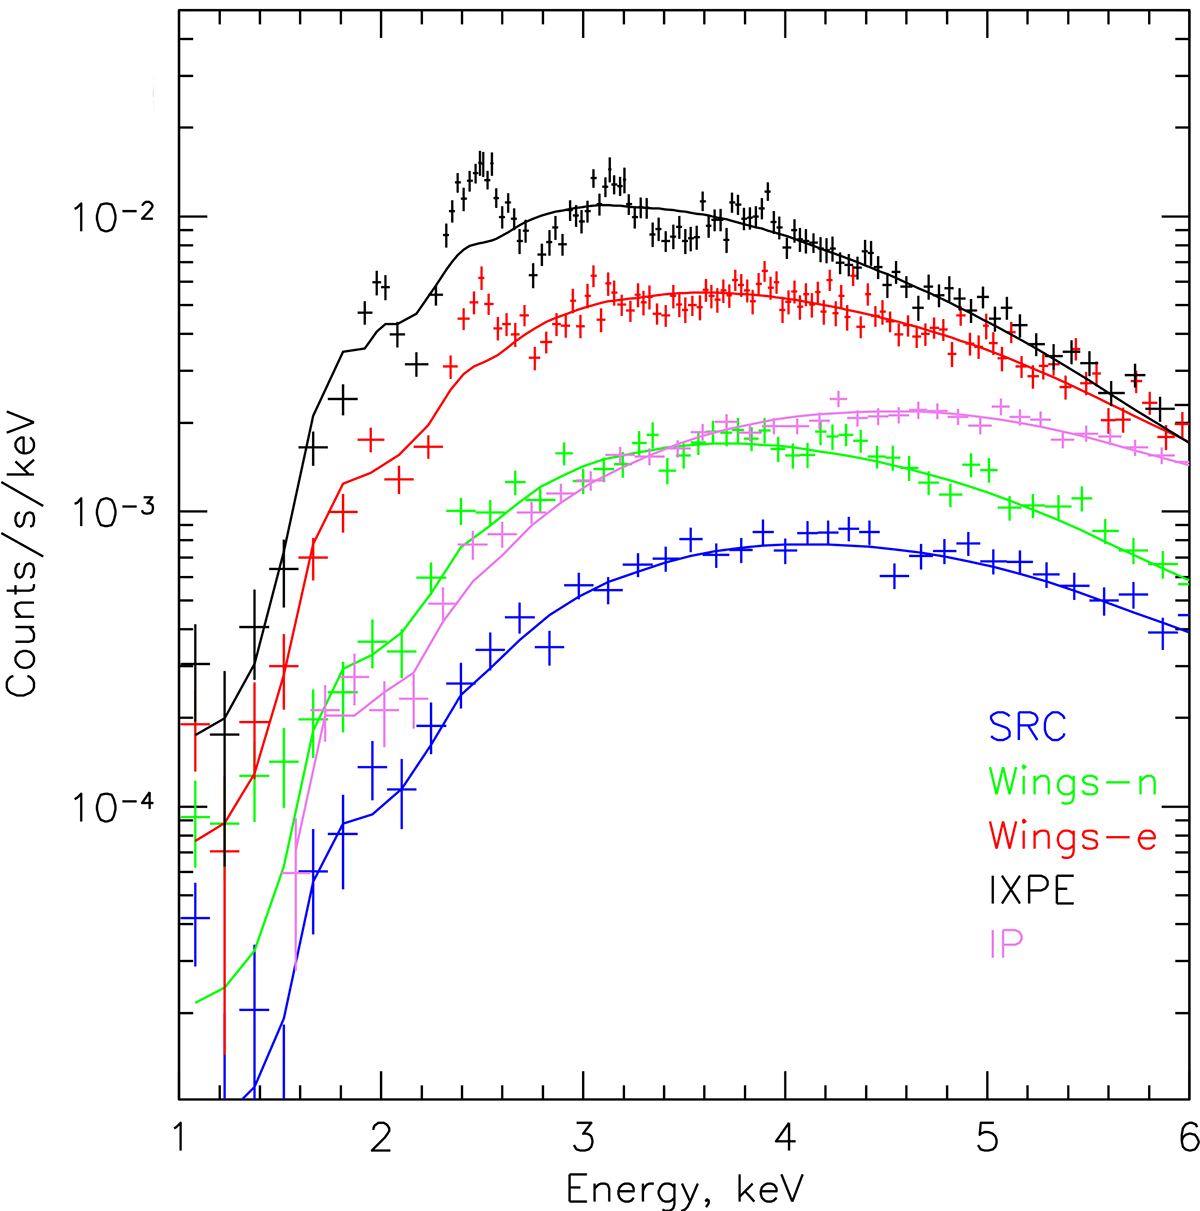
Fig. 4.
Download original image
Background-subtracted Chandra spectra in the vicinity of G0.13−0.11. The colors correspond to the regions shown in Fig. 3 and are identified in this figure. The solid lines show the best-fitting absorbed power-law model fits to these spectra. While a pure power law can describe the compact source spectrum (blue) reasonably well, other regions clearly contain a non-negligible contribution of thermal emission that gives rise to emission lines at low energies. The spectrum of the intermediate polar CXOUGC J174622.7−285218 is shown in purple.
Current usage metrics show cumulative count of Article Views (full-text article views including HTML views, PDF and ePub downloads, according to the available data) and Abstracts Views on Vision4Press platform.
Data correspond to usage on the plateform after 2015. The current usage metrics is available 48-96 hours after online publication and is updated daily on week days.
Initial download of the metrics may take a while.