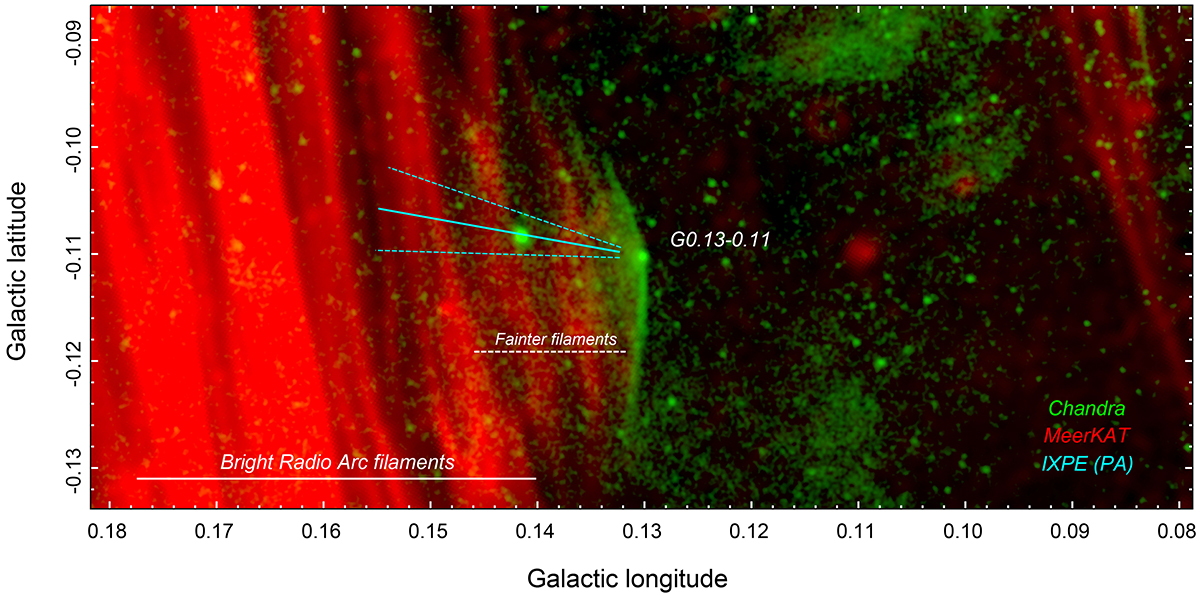
Fig. 1.
Download original image
Combination of radio (MeerKAT; 1.3 GHz, red) and X-ray (Chandra; 2.3−8 keV, Log scale, smoothed with σ = 0.5″ Gaussian, green) images of the G0.13−0.11 region in Galactic coordinates. The cyan lines show the constraints on the polarization angle (PA) of the G0.13−0.11 emission derived from the IXPE data (best-fitting value ±1σ error; i.e., 21 ± 9°). The prominent red vertical threads on the left side of the image belong to the NTFs of the Radio Arc. G0.13−0.11 is the green feature to the east of a sequence of fainter NTFs near the center of the image. G0.13−0.11 consists of (i) a compact core (the bright green dot at the center of the figure; presumably the pulsar itself and its PWN); (ii) a pair of bright “wings”; and (iii) a more diffuse (possibly structured) X-ray glow to the left of the “wings” (at higher Galactic longitude). The polarization direction is approximately perpendicular to the X-ray “wings” and the nearest NTFs. Coupled with the large polarization degree, this proves that X-rays are produced by synchrotron emission of ∼TeV electrons.
Current usage metrics show cumulative count of Article Views (full-text article views including HTML views, PDF and ePub downloads, according to the available data) and Abstracts Views on Vision4Press platform.
Data correspond to usage on the plateform after 2015. The current usage metrics is available 48-96 hours after online publication and is updated daily on week days.
Initial download of the metrics may take a while.