Open Access
Fig. 3.
Download original image
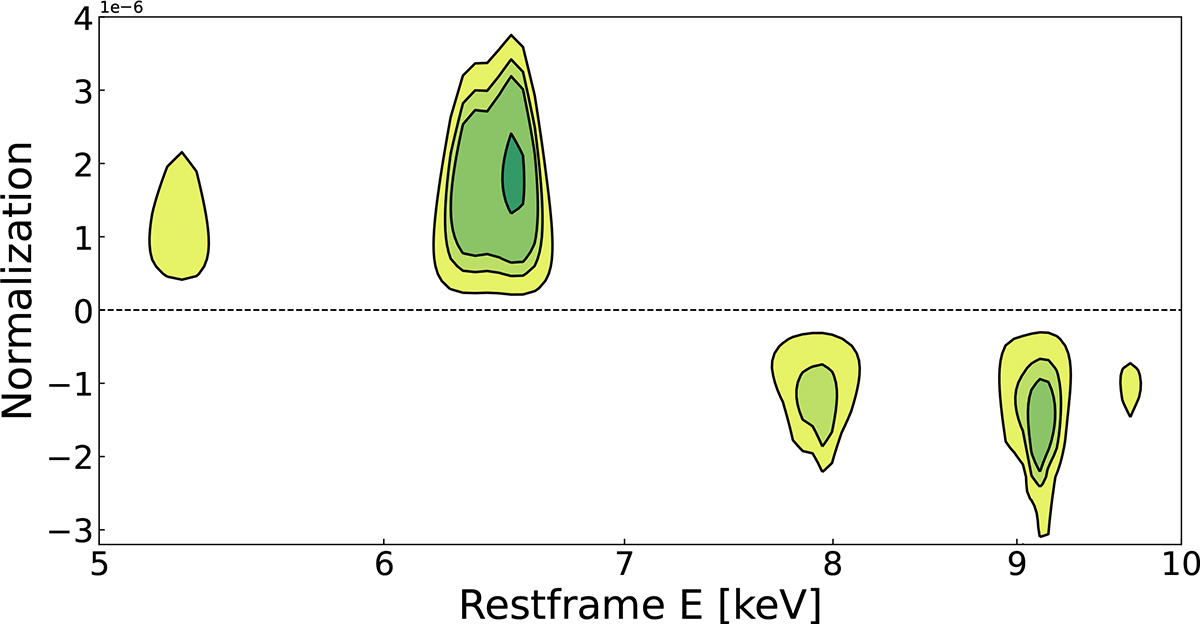
Line scan contours. The vertical axis corresponds to the line normalization values and the horizontal axis to the line energy in the source rest frame. The contours correspond to 68%, 90%, 95%, and 99% confidence level fit improvement (from lighter to darker).
Current usage metrics show cumulative count of Article Views (full-text article views including HTML views, PDF and ePub downloads, according to the available data) and Abstracts Views on Vision4Press platform.
Data correspond to usage on the plateform after 2015. The current usage metrics is available 48-96 hours after online publication and is updated daily on week days.
Initial download of the metrics may take a while.