Fig. 15.
Download original image
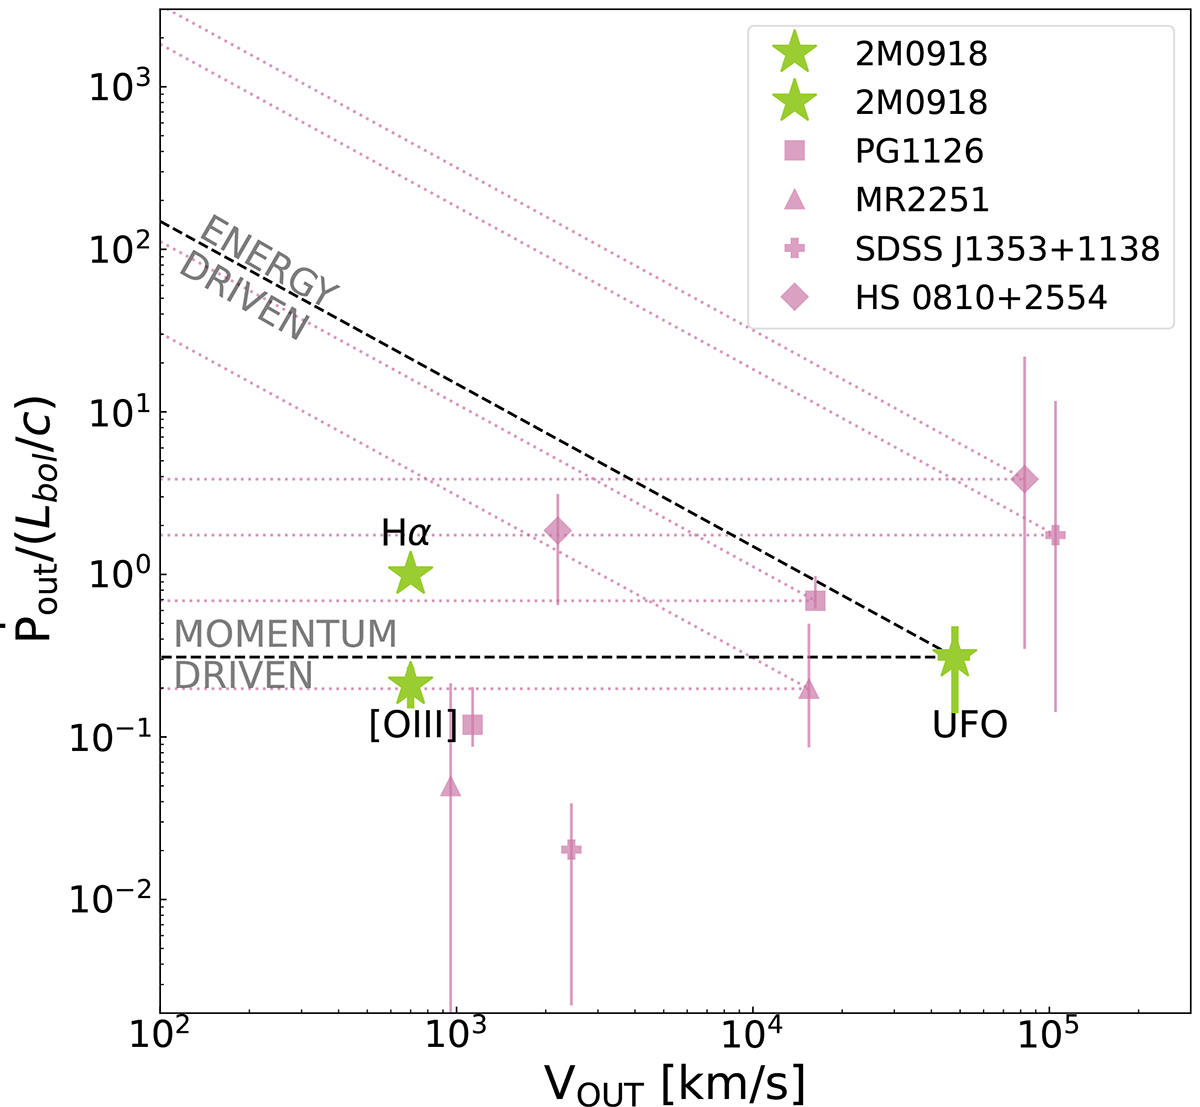
Momentum outflow rate normalized by Lbol/c vs. outflow velocity for 2M0918 (green stars, different components as labeled). The two solid lines correspond to the two different feedback mechanisms described in the text, as labeled. In the background are also plotted the sources from Marasco et al. (2020) and Tozzi et al. (2021) where galaxy scale winds are ionized, each with its respective diagnostic line.
Current usage metrics show cumulative count of Article Views (full-text article views including HTML views, PDF and ePub downloads, according to the available data) and Abstracts Views on Vision4Press platform.
Data correspond to usage on the plateform after 2015. The current usage metrics is available 48-96 hours after online publication and is updated daily on week days.
Initial download of the metrics may take a while.